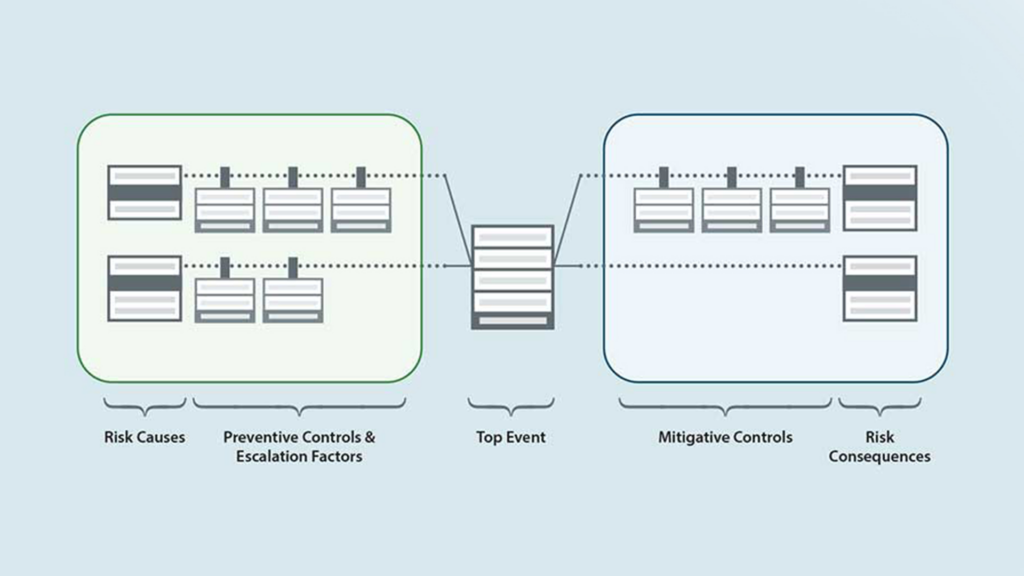
Bowtie analysis is a risk analysis methodology that focuses on risk interactions. We’ve covered a lot about it in our blog, but how does bowtie analysis compare to other analysis methods based on probability, like event tree and fault tree analysis?
The bowtie analysis method can be based on qualitative, semi-quantitative or quantitative risk calculations. All bowties calculate risk to find and assess causes and consequences, usually in terms of cause likelihood and consequence severity. Risk causes form a network of pathways leading to the risk event (also called the “top event” or “loss of control”), while the consequences form a network of pathways leading from the risk event to its harmful consequences.
Bowtie analysis is no less rigorous than the probability modeling involved in event tree and fault tree analysis. In fact, bowties are a way of modeling where fault trees and event trees merge in a risk scenario.
Imagine it in the scenario of a toxic gas leak. The release of the toxic gas is the risk event at the center of the bowtie; a lack of proper PPE and a weak control of work system are the possible causes of the release, represented on the left side; and fatal injuries from exposure to the toxic gas and significant recovery costs are the consequences from the release, represented on the right side of the bowtie.
Fault Tree Analysis in Bowties
The left side (causes side) of a bowtie diagram is essentially a simplified version of fault tree analysis. This aspect of the bowtie focuses on the failure aspect of a risk scenario and uses the top-down (or in the case of a bowtie, left-right) deductive failure analysis method of fault tree analysis. The aim of this is to identify the fault points at which a pathway to a risk event develops.
In bowtie analysis, using fault tree analysis provides a model of events (causes) passing through gates (controls) of Boolean logic (the conjunction [and], the disjunction [or], and the negation [not] of all values to determine ideal operations – mathematical and literal), which are designed to reduce the probability of the risk scenario eventually happening.
The emphasis at this point in the bowtie is on determining the optimal combination of checkpoints needed to prevent the loss of control event (the point at which the risk scenario occurs and has the propensity to cause harmful consequences).
The top event at the center of the bowtie is the point where the emphasis switches from prevention to mitigation. Every control on the fault tree analysis side of the bowtie is designed to prevent the top event from occurring. But if a loss of control does happen, what can we do to reduce the most harmful of consequences?
Event Tree Analysis in Bowties
The right side (consequences side) of a bowtie diagram is a simplified version of event tree analysis. Here, we examine the probable outcomes of the top event and model the pathways by which harmful consequences occur. The risk scenario travels along a series of events resulting in harmful consequence.
In bowtie analysis, event tree analysis functions in reverse to fault tree analysis. Controls are designed to intervene on the event pathway to reduce the probability of harmful consequences eventually happening. The emphasis here is on mitigating harm, assuming that the loss of control has already occurred, but that the occurrence of harmful consequences can still be averted.
Bringing the Trees Together
The first use of probability-based modeling in the form of bowties was pioneered in the 1970s, in the field of process safety. The underlying mathematics of it dates back centuries, although the event tree, fault tree analysis and bowtie models themselves are fairly recent inventions.
The extent to which bowtie analysis remains faithful to its probabilistic roots depends entirely on the method of risk analysis used. Quantitative or semi-quantitative bowtie analysis uses the probability of frequency to precisely model risk (based on certain assumptions). The more common method of bowtie analysis uses qualitative methods, which are much easier for most people to understand and use.
Bowtie analysis is a fantastic risk modeling tool because of its roots in event tree analysis and fault tree analysis. It allows the user to anticipate the pathways of the most credible worst-case scenarios, which allows for more confident decision-making in risk management.
