
Welcome to the second installment of our “Bowtie Analysis Blog” series. In our first installment, we talked about how risk bowties can help train your workers on workplace risks and the controls you have in place, and how bowties can keep employees engaged in your risk management practices. We also explained that risk bowties are much easier to do than you probably think.
This time, we’ll look at another benefit of risk bowties: their ability to synthesize data from many different types of risk assessments into a single, intuitive view of risk, and to overcome the limitations of tabular risk data.
A Multiplicity of Risk Methods
There are many ways of assessing workplace risk, including methods of root cause analysis for determining the underlying causes of an event after the fact, and methods used to prevent the occurrence of unplanned events.
Here is a survey of just some of the methods commonly used:
- Failure Mode, Effects & Criticality Analysis (FMECA): A quantitative failure analysis method that shows linkages between potential failures (failure modes) and consequences, as well as the relationship between the probability of different failure modes and the severity of outcomes.
- Fault Tree Analysis: A top-down analytical method that shows an unplanned event at the top, and all the independent contributing events below it, which are themselves broken down into distinct causes.
- Event Tree Analysis: An analysis showing all the possible consequences of an unplanned event, or loss of control, including estimated probabilities of different outcomes.
- Five Whys: A method of identifying a root cause by asking why it happened, then by asking why that happened in a series of five questions, each time going deeper than the time before.
- Hazard Identification Study (HAZID): A method of breaking down workplace processes to identify hazards, controls, and assess the effectiveness of controls at reducing risk.
- Hazard and Operability Study (HAZOP): A systematic assessment method that breaks down an existing process to looks for places that deviations from original plans occurred.
These different methods have their strengths and limitations. But a collective limitation of using so many methods is that it’s harder to view risk holistically. It takes work to dig through all those documents and assessments and synthesize a comprehensible view of risk that you can share with everyone in your workplace.
Or at least, it used to difficult to do that. With a solution like VelocityEHS Risk Management, you can select the assessments you want, then just hit the “Generate Bowtie” button. At that point, within just a few minutes, the software will:
- extract the hazard and top event details from the available data in the selected assessments.
- identify causes and associated preventative controls for each unplanned event.
- identify consequences and associated mitigative controls for each event.
- assemble all the elements and create a new risk scenario in the current risk register.
- set all the cause likelihoods, consequence severities and control effectiveness values and calculate and generate the risk bowtie, with all of the risk ratings.
Now you have a risk bowtie that combines all the information from individual types of risk assessments. The data is still there—it’s just much easier to understand and use. For example, the left side of the risk bowtie is a streamlined version of a fault tree, showing how different causes interact with preventative controls and escalation factors, which increase risk by reducing the effectiveness of controls. And on the right side of the bowtie, we have a version of an event tree, showing us the possible consequences of the unplanned event, the probabilities of each consequence, and the corresponding mitigative controls in place to reduce their impact.
The visual mapping of this information in one diagram makes it easier for you to train your workers on risk. And you can easily use that information as a foundation for further action, such as identifying critical controls, perform a Layers of Protection Analysis (LOPA), or Probable Loss of Life (PLL) calculation.
The Tyranny of Tabular Data
There’s another problem with having many different kinds of risk assessments other than the difficulty of consolidating information, especially if it’s in tabular form. Namely, tabular data can give us an inaccurate perception of risk, by making us think that risk pathways are simpler than they actually are.
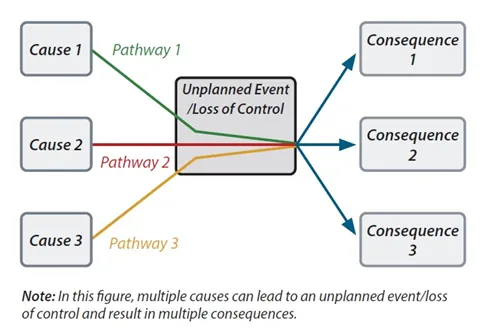
Think about it. When we use a table, we must worry about fitting all of the information about the causes of an unplanned event, the preventative controls present, the consequences of loss of control, and the mitigative controls in place into a tight space spread across one or two rows. Because what we see influences how well we understand, we then start thinking of risk for any specific unplanned event in terms of simple, linear pathways. That’s inaccurate, because unplanned events rarely result from just one pathway, and rarely have just one consequence. But it’s also dangerous, because that misunderstanding of our risk pathways undermines our ability to prevent major workplace accidents, and it places our workforce and business at risk.
Risk bowties help us escape from the tyranny of tabular data, and gain a more accurate view of risk pathways. Look how easy it is to map out different risk pathways in the figure below, and absorb information about multiple causes and consequences at a glance.
Looking for More Information?
Attend our upcoming virtual presentation, “Thunder River Rapids: A Case Study in Process Safety and Risk Management,” on July 21, 2021 from 1 pm to 2 pm Eastern as part of our Virtual CEU Conference. Dana Garber, Senior Risk Solutions Strategist, will be speaking about the benefits of risk bowties to improve the development and maintenance of performance standards and risk management procedures. The presentation will also look specifically at the ways that risk bowties could have prevented the 2016 malfunctioning of a ride at the Dreamworld theme park in Queensland, Australia that resulted in the death of four park guests. Register for the free conference here.
And for a quick guide to risk bowties, including an overview of how they work and why they’re useful training tools, download our brand new bowtie analysis infographic.
Finally, please check out the third installment of our Bowtie Analysis Blog series for more information about risk bowties
Let VelocityEHS Help!
Our customers consistently report that our bowtie analysis capabilities have helped them achieve dramatic improvements to workplace productivity, knowledge sharing and risk management program performance.
And bowtie analysis is just one of many tools within our Risk Management solution, along with risk registers, qualitative and quantitative risk analysis, layers of protection analysis (LOPA), critical controls verification and much more!
Ready to see more? Visit our Risk Management page to request a demo with one of our customer solutions consultants today!