


There are many articles and webinars on leading indicators at safety conferences and in EHS publications, and everyone rightly agrees they’re good things. But it’s not always clear to the average EHS professional what leading indicators actually are, how they improve safety, and what kinds of factors you need to consider if you’re going to effectively use them. Let’s see if I can fix that now.
In what follows, I’ll explain what leading indicators are, how they work, and how to make effective choices in your leading indicators. I’ll also highlight a specific test case on what good leading indicator selection and management look like in practice.
What are Lagging Indicators?
Before defining leading indicators, I need to define lagging indicators.
Lagging indicators are metrics related to your current or past state of safety. One easy way to tell that a metric is lagging is that it’s just documenting or measuring safety incidents that already happened – they’re backward looking. Common examples of these are the recordable incident rate (RIR), which measures the number of OSHA recordable injuries and illnesses per 100 full-time employees (FTEs), and the days away, restricted or transferred (DART) rate, which measures the frequency of injuries or illnesses resulting in restricted duty or days away from work. The image below, taken from instructions to OSHA’s Form 300A, indicates how to calculate the RIR.

What are Leading Indicators?
In contrast, leading indicators track activities related to achievement of a safety management goal. They look forward by making sure you’re taking proactive measures to achieve the results you want to see. In other words, leading indicators track the actions you’ve determined to be directly related to achievement of your primary goals. If you’ve chosen your leading indicators well, and you can verify that they’re trending in the right direction, you have reason to be optimistic that you’re on our way to meeting your goals.
Now that I’ve made that distinction, let’s muddy the water a bit, because people often get themselves twisted up trying to figure out which types of indicators are inherently leading or lagging. But already this discussion hints that the terms “leading” and “lagging” may not describe properties of the indicators themselves, as much as they describe what you do with them.
A 2020 Safety + Health article reviewed some of the nuances involved. For example, tracking of “near hits” or “close calls” is commonly thought of as a leading metric, even though they’re “lagging” in the sense of documenting unsafe events that already happened, because they’re used to identify and correct workplace hazards and improve future performance. Really, any measurable activity or trend, including even number of recordable incidents, can be a leading indicator if you proactively use it to identify and correct hazards and positively impact future safety performance.
How Do Leading Indicators Help Improve Safety?
This explanation of leading indicators makes a nice segue to show how choosing and tracking the right leading indicators help you improve safety. In short, it’s by making sure you’re paying attention to future performance, not just past performance.
You need to understand past performance, of course, and regulations such as OSHA’s Recordkeeping Standard actually require many businesses to track lagging metrics such as numbers of recordable injuries and illness and RIR. As I’ve just explained, lagging metrics can also sometimes double as leading metrics if you’re using them to engage with and improve your safety performance. But ultimately, you need more than metrics that are only based on past hazardous conditions and past behaviors that led to safety incidents. You need a good range of carefully chosen present-focused leading metrics to improve your ability to actively investigate and address current hazards. If you’re not doing so, all your metrics tracking really is doing is documenting your poor safety performance, rather than enabling better future performance.
Leading indicators help by providing tangible actions to take today to positively influence safety outcomes. Organizations with a robust leading indicator program have the advantage of a proactive approach rather than a reactive approach, which helps them identify and correct hazards before they can lead to injuries and illnesses.
Of course, the effectiveness of leading indicators depends on choosing them wisely, which is what I’ll cover next.
Choosing Your Leading Indicators
One of the common misconceptions about leading indicators is that any leading indicator is automatically “better” for safety management than any lagging indicator. One reason this assumption is false is that the distinction between leading and lagging indicators is not always clear, and it depends largely on what you do with them. Another reason is that leading indicators only work as well as you hope they will if they’re measuring an activity crucial to improving safety, and you’re effectively managing them.
For example, many EHS managers I’ve known have considered “safety tours” or “safety stand downs” to be classic examples of leading indicators. These are events in which a group of employees, often involving management leadership, spend some time allotted to finding hazards and opportunities for improving safety. Sure, that seems proactive and positive and all such nice things. And these events certainly can be good leading indicators, but it’s also entirely possible that they’ll have no impact at all on safety. I’ve seen too many “safety walk throughs” that were unfocused and unspecific in their aims, and which failed to go deep enough into working conditions or engage enough with employees to generate actionable “intelligence” about safety.
You need more than leading indicators—you need the right leading indicators. OSHA provides an excellent guidance document called Using Leading Indicators to Improve Safety and Health Outcomes, shown in the screen capture below.

In this guidance, OSHA advises that effective leading indicators need to have the following “SMART” characteristics:
Specific: Your leading indicators needs to clearly specify what you’ll be doing and tracking to achieve a safety goal.
Measurable: If you can’t measure your leading indicator, you also can’t track it, which defeats the whole purpose.
Accountable: Being accountable in your choice of leading indicators means that you’re deliberately choosing to track activities that are going to make progress toward our goal. The concept of relevancy is baked into this—you’re showing that you take the goal seriously by doing the things you need to do to achieve it.
Reasonable: There’s no use setting goals that are more aspirational than they are achievable in the real world, and then having to track leading indicators that will just document your failure to do what couldn’t be done. Reasonableness is related to accountability, because if you’re serious about improving safety, you need to choose realistic goals and relevant leading metrics.
Timely: Are you choosing a leading metric that’s readily trackable, and are you tracking it frequently enough to identify and address trends?
You’re more likely to choose and manage your leading indicators well if you have the full engagement of all workers throughout your organization. Make sure you’re including them in all parts of the process, from participation in incident investigations and risk assessments to planning of corrective actions, and specific leading indicators needed to address identified hazards.
Test Case: Preventing Trips and Falls
Let’s take a closer look at how leading indicators can help by focusing on a specific test case, of preventing trips and falls.
Here’s the situation. Suppose you notice from your incident tracking that you’ve had a surge in trip/fall injuries, and digging further, you see that they’ve mostly happened in a single area. Thanks to your employees’ participation in root cause analyses for those incidents, you learn that the falls happened because of tools and packaging materials obstructing walkways. You resolve to reverse this trend—reduction of trips and falls becomes a primary safety management goal.
But how do you get there? That’s where leading indicators come in.
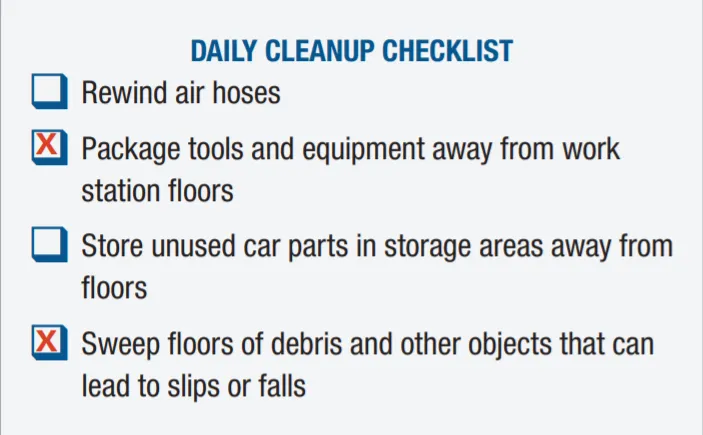
Your first step is to carefully choose leading indicators that are likely to help achieve your objective. If your objective is to reduce trips/falls, then choosing leading indicators aimed at eliminating the causes of those incidents seems like just the ticket. Since in this case you know that cluttered walkways are the root cause of your incidents, a good strategy is to do inspections to ensure that walkways are unobstructed. Specifically, you determine that you need to inspect floors in this area daily, and develop a specific checklist to ensure you’re looking at the right things, like in the example below.
As part of your adoption of this leading indicator, you also adopt a schedule to review your progress. Once per week, you’ll review the daily inspection records for the past week, and identify deficiencies, such as incomplete checklists or inspections that are uncompleted. Then you can determine the reasons for the issues we’re seeing and put corrective actions in place, and see if the actions taken appear to be effective during future weekly reviews.
You can see how this example meets all the SMART criteria mentioned above. It’s specific because you’re using a tailored checklist for your inspection, and you’re tracking the number of inspections that don’t identify obstructions as a key metric. It’s measurable because it’s simple enough to track the inspections, especially if you’re using the right EHS software to conduct the inspections in the first place. You’re being accountable because you used your incident management analytics to identify a problem and its root cause, and then set up an activity to address the root cause. It’s reasonable because your stated goal of reducing the incidence of trips/falls was achievable. Finally, you made sure it was timely by doing an inspection frequently enough to be able to identify meaningful trends.
Leading Indicators and Predictive Analytics
This example suggests some of the ways that healthy use of leading indicators dovetails with the emerging area of predictive analytics in safety data management. Increasingly, EHS software is evolving from being a simple storehouse (or “dead letter office!”) for safety data toward a source of intelligence for making better, more proactive decisions to improve safety.
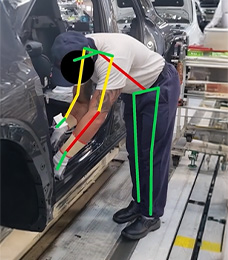
An example of predictive analytics is use of artificial intelligence (AI) in ergonomics software to analyze job tasks and physical motions to identify potential overexertion hazards that if left unaddressed, could lead to musculoskeletal disorders (MSDs). Another is use of incident management software to identify patterns and trends within incident records that you can address with actions, including inspections such as in the example discussed earlier, to prevent future incidents.
Leading indicators and predictive analytics share a focus on planning, and on proactivity over reactivity. Adding some predictive analytics capabilities to safety programs built on a solid foundation of leading indicators can be a great way to continue evolving toward a safety management system that shapes its own future, instead of simply reacting to its past.
Key Takeaways on Leading Indicators
- Lagging and leading indicators are both important. You need to model your safety management system after the Roman god Janus, whose two faces look behind him and ahead of him at the same time. To know where you’re going, you need to know where you’ve been. In fact, we’ve seen that the dividing line between leading and lagging indicators can be blurry, and the distinction really comes down to how we’re using any particular indicator.
- Choose your leading indicators well. Leading indicators aren’t inherently magical. They’ll work only if you take the time to choose them well, based on your own analysis of your most relevant safety issues and their contributing causes, and then effectively review and manage them. OSHA’s SMART principles are great criteria for selecting and tracking your own leading indicators.
- Involve your employees. Your employees probably have more information relevant to safety than you do, because they spend every day in the workplace performing various job tasks. Actively seek their input and involve them in every step of the process.
- Leading indicators help you shift from reactive to proactive approaches. Leading indicators can be one of the main pillars of a sturdy safety management system that both evolves with your organization, and itself shapes its future.
Looking for More Information?
I’ve drawn from OSHA’s great guide on leading indicators in a few places, and highly recommend that interested readers check it out in its entirety.
For a great discussion about leading and lagging indicators, check out the American Society of Safety Professionals (ASSP) webinar here. And if you can find it, hunt down an article by Pam Walaski, CSP called, “The Role of Leading and Lagging Indicators in OSH Performance Management,” published in the August 2020 issue of the American Society for Safety Professional (ASSP) journal Professional Safety Journal. It’s not only one of the best pieces on leading indicators I’ve seen but also one of the best pieces on safety management period.
Finally, if you’re looking for a presentation that goes into detail about performance metrics and provides specific examples of both leading and lagging indicators, check out our own on-demand webinar:
“EHS Performance Metrics: How to Drive Workplace Safety and Sustainability Through Better Data”
Let VelocityEHS Help!
VelocityEHS understands that successful safety management means being proactive, and that’s why we’ve created a platform that gives you all of the tools needed to identify and correct hazards, and makes it easy for your workforce to participate. The Inspection capability within the VelocityEHS Safety Solution makes it easy to develop tailored checklists you can use to conduct inspections connected to your safety goals, and from there, Action Management lets you easily prioritize and track follow-up actions. The Incident Management capability can help uncover patterns hiding in your safety data that can inform your future actions to improve safety. And the industry-recognized VelocityEHS Ergonomics solution gives you powerful AI tools to identify job tasks and associated employee physical motions with the potential to result in MSDs, so you can reduce ergonomic risks before an injury happens.
And those are just some of the ways we can help you become safer and more sustainable. Visit ehs.com for more information, or contact us anytime.