


Welcome to our seventh and final installment in our IH 101 series! It’s been quite a journey so far, but we definitely saved the best for last.
Last time, in Part 6 of our IH 101 blog series “Medical Surveillance – Strengthening Your Last Line of Defense for Worker Health,” we learned the basics of IH medical surveillance and a step-by-step process you can follow to simplify compliance with your medical surveillance requirements. Additionally, we offered an approach to integrating medical surveillance tracking software with your company’s HR data to automate enrollment and de-enrollment of workers in your medical surveillance programs (MSPs) – saving countless hours and resources.
In this final article of our IH 101 series, we’ll focus on how to effectively communicate the status and value of your IH program to both workers and management to help strengthen engagement and buy-in.
Recommended Readings
Before you read on, we recommend reviewing the previous installments of our IH 101: Introduction to Industrial Hygiene Program Management series:
- Part 1 – Similar Exposure Groups (SEGs)
- Part 2 – Qualitative Exposure Assessments (QEAs)
- Part 3 – Sampling Plans
- Part 4 – Lab Analysis
- Part 5 – Data Analysis
- Part 6 – Medical Surveillance
We also highly recommend downloading our IH Program Cycle Infographic and IH Program Guide on the 7 steps to effective industrial hygiene (IH) program management to help you understand how each of these parts fit into the overall IH program management structure.
So…What is the Status of Your IH Program?
If you were to ask business managers what the status of their business is, they would discuss their profit margin, EBITA, percent growth in revenue or other common financial metrics.
If you were to ask safety managers, they would let you know about the number of days without a recordable injury or their incident rate and how it compares with last year.
As an IH professional, how would you answer the question: “What’s the status of your IH program?” Would you pull up a bunch of statistics? A list of SEGs? Perhaps you would show them your sampling plan for the year?
If you are having a hard time identifying the best data points, statistics, tables or diagrams to show – you’re not alone. This has been a long-running challenge in our profession and, I believe, a big reason why most stakeholders don’t understand what IH is or the value we bring to the business.
Documentation AND Communication
Industrial hygienists are very good at documentation, but most of us need to improve our communication. We generate employee notification letters, tables and charts of sample results and include them in quality reports that are sent to management, but are there any two-way communications? Do we present our findings in-person and make time for dialog, discussion or Q&A? What happens with the reports we generate for data users? Are they just filed and eventually shipped to a salt mine for long-term storage without providing any real value for the business?
We all learned in school or from our supervisors how to write great IH reports, but most of us have not received any real training on how to engage and collaborate with workers and management to communicate IH data in a meaningful way. We’re unfortunately all-too content to keep the details in our black box and just document our findings.
The problem with just documenting our findings and not having meaningful dialog about them is that workers and management will not understand why you conducted the monitoring or performed the risk assessments in the first place. If they don’t understand the “why”, they surely won’t understand the value you or the IH program brings to the business.
“If it Ain’t Broke, Don’t Fix it!”
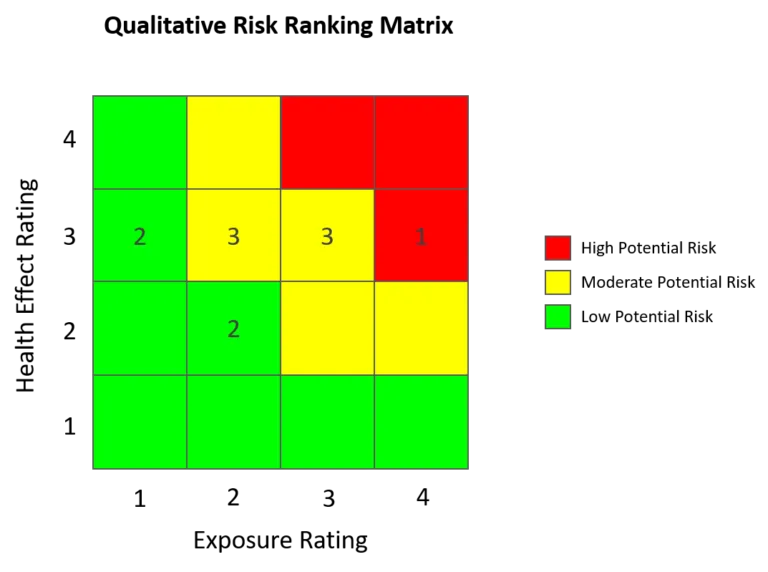
I am big believer in leveraging what works within your company’s culture. For most companies, important safety, quality and other risk information is already being summarized using a standard risk matrix, and stakeholders are likely accustomed to referencing other types of risk matrices to quickly understand the presence of risks in the workplace.
As we talked about in Part 2: QEAs – Essential Risk Assessment Methodologies for Industrial Hygiene Program Management, a risk matrix is a valuable tool already in your toolbox that can also be used to summarize exposure and worker health risks. In the case of IH risks, rather than using severity and likelihood as our key risk variables, the IH risk matrix uses health effect ratings and exposure ratings to rank and prioritize risks.
Improving the Resolution of Your Risk Assessments
To get the full picture of the status of your IH program, you also need to identify and illustrate your level of confidence with your QEAs. This is best indicated by an uncertainty rating assigned to each QEA (discussed in Part 3: Sampling Plans – Moving Beyond Compliance).
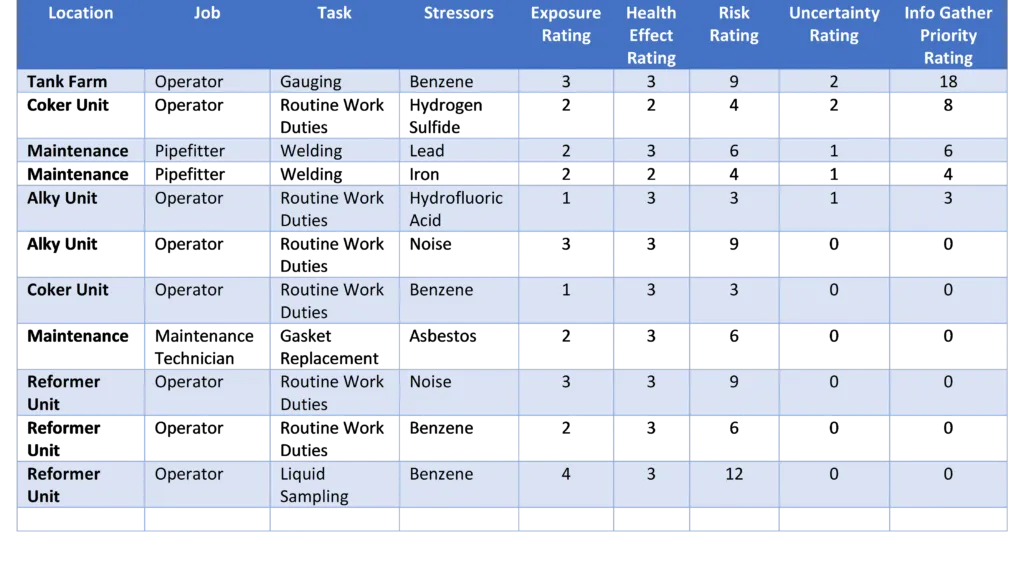
Table 1: Extension of QEAs for determining Info Gather Priority Rating
In Table 1, line items with an uncertainty rating of zero indicate a high degree of confidence, while those with a 1 (uncertain) or 2 (highly uncertain) need additional investigation – thus, a higher info gathering priority rating.
Using the information in Table 1, we can quickly show stakeholders some key IH program insights, including:
- The current number of risk assessments and what level of risk they each have (e.g. high, medium, low)
- Details of the jobs, tasks, location, and stressors that make up the health risks
- The degree of certainty with our health risk ratings
- Where additional resources are needed to improve the degree of confidence in the health risk ratings
To ensure effective communication of risks, these values should be discussed with workers and management – giving them ample opportunity to ask questions and have an open dialog on the data. Ideally, this will instill greater understanding and appreciation of what IH is and its value to the business, and ultimately strengthen engagement with your IH program.
Bonus: Tools & Skills for Communicating Control Measures
Risk matrices can also be used to help build support for risk control measures. It’s very common for management to ask, “How can we reduce the red (high risk) items to yellow or green?” You can easily illustrate the answer to this question by using two matrices; one before risk controls are implemented and one after controls are put in place. This will tell you the initial and residual risk.
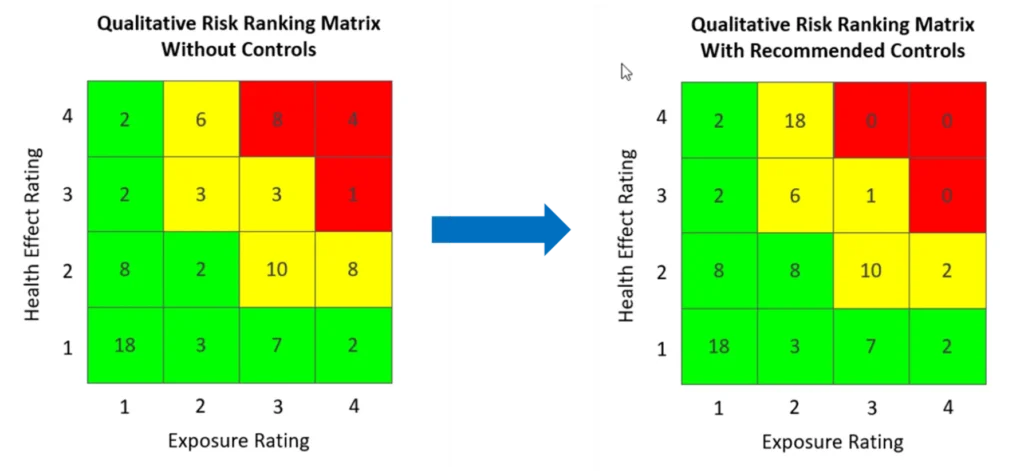
Here, we can see the initial risk (before controls) on the left and residual risk (after controls) on the right. Looks great, huh? But it’s never quite that simple. You must be armed with data to show what it takes to reduce those red items. When communicating control activities and effectiveness, we strongly recommend the following:
- Present Multiple Alternatives: If you present only one control option, the only possible responses are yes or no. If you present multiple options, stakeholders are much more likely to assess the options in relation to each other and choose one of them rather than taking no action. They will appreciate the amount of work you did to provide options, and not putting them into the position where they are simply approving or disapproving a control measure for which they had no input.
- Present a financial analysis: Most of us are not experts on financial analysis, but we still should be able to provide some basic information about control alternatives including:
- Price
- Return on Investment (ROI) – percent cost savings or benefits in dollars above the cost of the control over a specified time period
- Breakeven Point – how long does it take for the benefits from installing the control to pay for itself. Every day after the breakeven point translates to a cost savings for the company.
When gathering financial information, remember to add items such as increased production, improved quality, decreased loss of product, reduced PPE expense, fewer days away, etc. Sometimes those additional items have the biggest influence on supporting the investment for the control.
Other IH Program Resources
A comprehensive IH program has many moving parts. Your SEGs, QEAs, sampling plans, lab analysis, reporting and MSPs and reporting all deserve equal focus, and should be carefully coordinated to ensure optimum IH program performance.
Our certified IH experts have developed two new complimentary resources – the IH Program Cycle Infographic and IH Program Guide which will introduce you to a proven, process-based IH program management framework built around continuous improvement principles and AIHA best-practices. Download them today!
We’ll also be hosting a series of IH webinars beginning on June 8, 2021 where you’ll get an in-depth look at each of the elements of a successful IH program, and have all your IH questions answered. Click Here to Register Today!
Ready to Upgrade Your IH Program?
VelocityEHS IH Solutions give you a software system that’s purpose-built to coordinate and maintain a comprehensive IH program founded on AIHA best practices. Designed by our in-house team of Certified Industrial Hygienists (CIHs), VelocityEHS IH Solutions help you easily assess and control workplace stressors, automate time-consuming IH program tasks, and maintain a world-class IH program no matter your level of IH expertise. Visit our IH Solutions Page to Learn More!
Ready to see for yourself how VelocityEHS can help you revolutionize your IH program? Contact Us or Request a Demo today!