


In Part 4 of our IH 101 blog series “Lab Analysis – Uncovering Hidden Gems of Efficiency“ we learned some of the most important factors to consider when selecting a laboratory, and steps you can take to automate the chain of custody (COC) and upload of analytical results from your samples. In Part 5, we’ll focus on best practices for defining what questions you want answered about the performance of your IH program, and how to select the best metrics to answer each of your questions.
Buckle up! It’s going to get a little technical but don’t worry, we’ll walk you through.
Recommended Readings
Before you read on, we recommend reviewing the previous installments of our IH 101 Introduction to Industrial Hygiene Program Management series:
- Part 1 – Similar Exposure Groups (SEGs)
- Part 2 – Qualitative Exposure Assessments (QEAs)
- Part 3 – Sampling Plans
- Part 4 – Lab Analysis
We also highly recommend downloading our IH Program Cycle Infographic and IH Program Guide on the 7 steps to effective industrial hygiene (IH) program management to help you understand how each of these parts fit into the overall IH program management structure.
Defining Your Goals
Before diving into statistical analysis of your data, it is absolutely critical to define why you are performing an analysis in the first place, and what conclusions you hope to confirm or reject through that data. There’s a wide array of different statistics, graphs and analysis methods that can be performed based on the questions you’re trying to answer and the data set being assessed. Some analyses can be done quickly using a simple excel formula or calculator, while others may require more complex statistical analysis tools.
Whatever analysis methods you use, some common IH questions they should answer are:
Are exposures in SEGs consistent?
Even our best professional judgement is not always 100% accurate. In many cases, SEGs are formed based on our qualitative observations and previous experience, but it is good practice to validate those exposure assessments to verify our qualitative assessments for those stressors.
Two of the more common methods for this include analysis of variance (ANOVA) and scatter diagrams. ANOVAs are very precise but are complex to perform, can take time and may not be practical to perform for each and every SEG. A simpler method would be to use a scatter diagram and look for clusters of data. This is more subjective, but can provide a quick glance at how similar the exposure data is within the SEG. See the “Keep it simple” section below for an example.
Are the Exposure ratings accurate?
If your exposure ratings include quantitative data such as “Percent of OEL”, it is good practice to confirm your exposure risk ratings using IH sample data. We’ll discuss some helpful tools and statistics that can be help with this. The challenge is deciding which statistic to use. Before spending time generating a lot of statistics, it is important to first determine which statistics to use for confirming your exposure ratings. Common examples include:
- 95th Percentile
- 95% / 95% UTL
- 90% or 95% UCL
- % > OEL
- Geometric Mean & Standard Deviation
When using precise statistical analysis, it matters if the data set follows a normal or lognormal distribution. When assigning exposure ratings, the degree of error isn’t significant enough to be concerned with. The EAS Bayesian tool we’ll discuss below is a tool that enables the use of small data sets that, when combined with your professional judgement, provides confidence that you have selected the correct risk rating.
What’s the likelihood of exceeding the OEL?
This is very similar to the previous question. However, you should first determine if your distribution is normal or lognormal. It is important to first determine which statistics to use. Again, common examples are:
- 95th Percentile
- 95% / 95% UTL
- 90% or 95% UCL
- % > OEL
- Geometric Mean & Standard Deviation
Are the control measures working as designed (control verification)?
Measuring the effectiveness of exposure risk controls is generally a simple task, but you should have an idea of what the expected results are. If a process was changed from an open process to a closed-loop process, it may be fair to assume the exposure should be less than the limit of detection. If the control was designed to reduce exposures, it should be estimated by how much – or at least designed to reduce the exposure below a certain threshold.
Either way, there should be a clear metric to measure effectiveness of your controls.
What SEGs need to be included in medical surveillance program (MSP)?
Most workplace exposure standards specify a threshold (OEL/PEL/TLV) of exposure that, if exceeded, requires workers be placed into a MSP. Keep in mind that once an exposure exceeds the permissible limit, there are direct exposure controls and other actions that must be taken to minimize/eliminate the exposure and protect the worker. When it comes to MSPs, you are looking at the worse case exposures and not average exposures.
Do we have sufficient sample data or how much more sampling is needed?
Unfortunately, this is a question that is way too complex to answer in a single article. Luckily, there are several reliable models you can follow to help make this determination. Some regulations have specific quarterly monitoring that is required, while others such as Europe’s EN689 provide a very defined methodology for collecting a small set of data, and and performing supplemental sampling when exposures exceed their parameters. The regulation also provides a strategy for reassessments with time intervals ranging from one to three years depending on the levels of exposure.
As we briefly mentioned, the EAS Bayesian tool discussed below is another tool you can use to help reduce the number of samples needed by combining a smaller data set with your professional judgement. The combination of your professional judgement and hard data provide a high level of confidence as to the true level of exposure.
Common Statistical Tools
There are a variety of tools available to assess exposure data. While most are free, some require a license to be purchased. Here’s a few of the most commonly used resources:
IHSTAT
IHSTAT is a free excel worksheet that checks for log-normalcy and provides several common statistical analyses of IH data and compliance testing. This commonly used tool was developed by AIHA and is available for free.
Macro-free version (English only): Download
Multilingual version: Download
EAS Bayesian
Dr. Paul Hewett of Exposure Assessment Solutions developed the market-leading Bayesian analysis tool. He provides training sessions and webinars throughout the year on the software and other statistical topics. The Bayesian software has a free version (IHDA-Student) which is intended for use by students or EHS professionals in training. The IHData Analyst Professional version is intended for organizations looking to use it in their IH programs. Both versions are available HERE.
BWStat
BWStat is an Excel tool developed by Tom Geens and hosted by the Belgium Society of Occupational Hygiene. It allows the estimation of compliance with OELs, taking into account the intra- and inter-individual variation in repeated measurements. It was built to help facilitate the implementation of the BOHS-NVvA Guidance. You can download BWStat HERE.
HYGINIST
HYGINIST calculates similar statistics as the IHSTAT tool, but is a bit more complicated to use. It is free to use and offers additional statistics such as the 70% confidence for help with EN689 compliance testing. It can be downloaded HERE.
EXPOSTATS
EXPOSTATS is a Bayesian analysis tool developed by Jérôme Lavoué of the University of Montreal and is available in English and French. The tool is available online and offers several different analysis tools and nice graphic outputs. These tools are available for use HERE.
Keep It Simple…
As industrial hygienists, we love to play with data. You’d be amazed by the amount of great statistics that can be quickly generated using any of the tools mentioned above. While these are informative tools for advanced EHS professionals and provide a very detailed view of your IH data, effective IH management doesn’t need to be that complex.
For example, when determining if the exposures for a SEG are consistent, you can perform an ANOVA or simply create a scatter diagram and look for clusters.
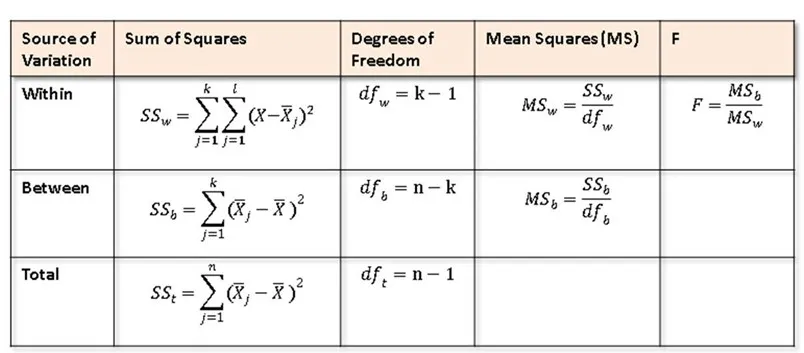
Formulas for Analysis of Variance (ANOVA)
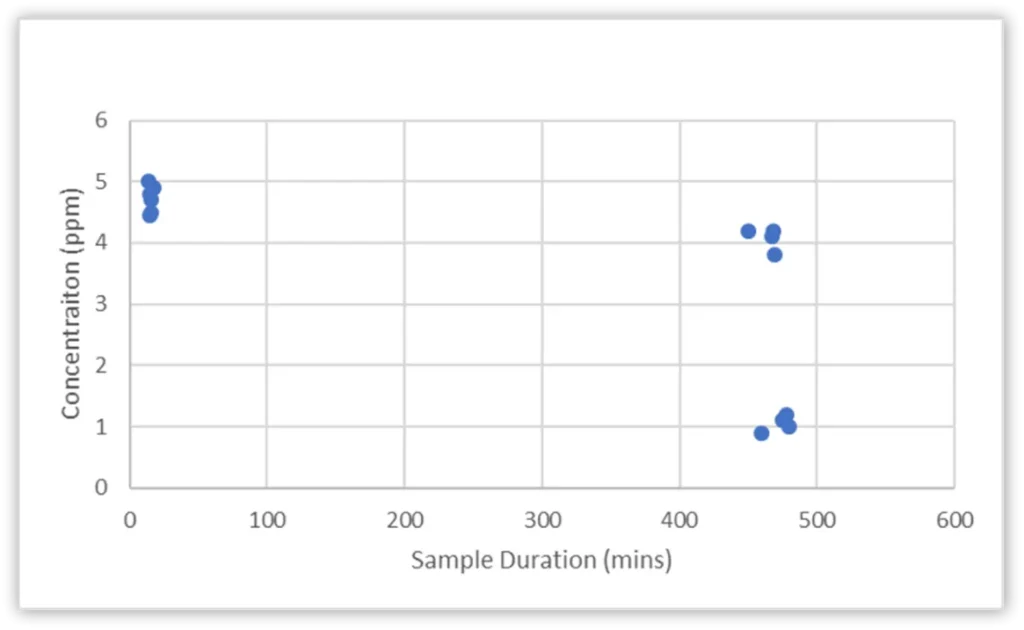
Example of a Scatter Diagram
Even the formulas used for ANOVA can be intimidating, let alone the time it takes to perform one. Alternatively, the scatter diagram can be quickly generated using Excel.
The example scatter diagram above illustrates short-term exposure limit (STEL) samples conducted in a nice cluster, while the full shift exposures around 480 mins show two different clusters of sample results. At this point, investigation should be done to determine why there are two clusters. Was it due to equipment the worker used? Their location? Their work practices? Regardless, the SEG in this example may need to be split into two different SEGs based on the data.
Whatever tool you use to analyze the sample data, think carefully about what statistics or methods are most helpful in making decisions and communicating information about your IH program. Far too many EHS professionals try to present and communicate complex statistics to workers and management. This is a common mistake that only succeeds in confusing them, at which point they completely lose interest. The data needs to be presented in a simplified manner that’s easy to understand. We’ll take a more detailed look at best practices for accomplishing this in upcoming article “IH 101 Part 7: Evaluating and Communicating Performance.
Other IH Program Resources
Performing analysis of sample data is just one of the many moving parts that make up an effective IH program. Your SEGs, QEAs, sampling plans, medical surveillance and program evaluation processes all deserve equal focus, and should be carefully coordinated to ensure optimum IH program performance.
IH Program Infographic & Guide
Our certified IH experts have developed two new complimentary resources – the IH Program Cycle Infographic and IH Program Guide which will introduce you to a proven, process-based IH program management framework built around continuous improvement principles and AIHA best-practices. Download them today!
IH 101 Webinar Series
VelocityEHS will also be hosting a series of IH webinars where you’ll get an in-depth look at each of the elements of a successful IH program, and have all of your IH questions answered. Click Here to Register Today!
In the Meantime…
VelocityEHS IH Solutions give you a software system that’s purpose-built to coordinate and maintain a comprehensive IH program founded on AIHA best practices. Designed by our in-house team of Certified Industrial Hygienists (CIHs), VelocityEHS IH Solutions help you easily assess and control workplace stressors, automate time-consuming IH program tasks, and maintain a world-class IH program no matter your level of IH expertise. Visit our IH Solutions Page to Learn More!
Ready to see for yourself how VelocityEHS can help you revolutionize your IH program? Contact Us or Request a Demo today!