


What is Risk?
In light of the COVID-19 pandemic and its widespread social, financial and economic impacts, I’d like you to take a moment right now to think about what ‘risk’ means to your business. Seriously, just take a moment.
Your business’s unique risk exposure will ultimately depend on a wide variety of factors including your operations, industry, regulatory requirements and workforce characteristics, just to name a few. These factors combine in complex and unpredictable ways, creating risks that can be difficult to anticipate and control. But with the fate of your workers, your community and your business potentially at stake, it’s essential that you understand precisely how these factors shape your business’s risks so you can manage them effectively. In what follows, you’ll see how a tool called bowtie analysis helps connect the dots between risks, root causes, and impacts.
Risk Analysis Techniques
There are a variety of risk analysis techniques available to help identify and quantify workplace risks. These techniques typically fall into two categories, top-down and bottom-up.
Top-down risk analysis techniques rely on looking at individual risk scenarios and working out how they might be caused, what impacts they may have and what controls would minimize those impacts. Top-down analysis is the best option when a business knows the risk scenarios that may be encountered, and has the experience to map out and control those risks.
Bottom-up assessments start by documenting all the elements of a system or process, identifying all possible interactions between those elements, quantifying the likelihood and severity of those interactions, then implementing the controls necessary to minimize the risk level.
Top-down, bottom-up. Seems pretty straightforward, right?
Maybe…
For either of these two approaches to work, we must also clearly identify the root causes and potential impacts of risks, understand how effective our controls are, and be able to trust that everyone has a shared understanding, acceptance and ownership of the risk management activities we’re performing. Without all three of these, you might as well save your breath.
If you really want to create a more complete understanding of the risks facing our business, we need to take a more sophisticated approach to risk analysis and control. That’s where bowtie analysis comes in.
An Introduction to Bowtie Analysis
Bowtie analysis is an advanced risk analysis technique that gives users the ability to not only evaluate the probability and severity of risks, but also document risk causes, quantify potential risk impacts, assign and monitor risk controls, and systematically evaluate the full spectrum of factors that contribute to your organization’s overall risk exposure.
In addition to centralized planning, coordination and tracking of risk management activities, one of the biggest advantages of bowtie analysis is that the bowtie structure creates a visual illustration of the linkages between risk causes, events, impacts and controls. In essence, bowtie analysis offers a detailed map of workplace risks so that stakeholders throughout the organization can easily understand their sources and consequences.
Performing a Bowtie Analysis
Before we begin, it’s important to remember that effective bowtie analysis requires sufficient time, consideration and input from the appropriate stakeholders to ensure that you’re identifying ALL perceivable causes and impacts for a given risk. Performing a bowtie analysis should be a team exercise, and formal stakeholder workshops are an ideal setting for developing your bowties, and obtaining the greatest possible insights into the risks affecting your business.
Step 1: Defining the Risk Event
Bowtie analysis begins with identification of a risk event, sometimes referred to as a “top event.” The risk event can be any undesirable workplace condition or outcome, and will typically be one that you’ve already identified through your HAZOPs, HAZIDs, PHAs or other preliminary risk study. The risk event provides everyone workshop with a clear starting point and context for the assessment. Once you’ve identified the risk event you want to analyze, place it in the center of the bowtie diagram (Figure 1).
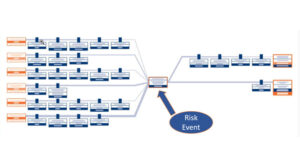
(Figure 1)
It’s important to remember that the risk event is the point at which we lost control of the situation and NOT the impact that might arise following that loss of control. To illustrate this point, consider the example of a motor vehicle accident. In a motor vehicle accident, the risk event would be when the driver loses control of the vehicle, not when the car hits a barrier, pedestrian or other object. The distinction being that loss of vehicle control does not necessarily result in any damage (impact).
Step 2: Charting Risk Causes & Impacts
Once you’ve identified the risk event, you can begin to chart potential causes and impacts of that risk event. To the left side of the diagram, all the potential causes of a risk event are listed. To the right side, all the potential impacts of the event are listed (Figure 2). Remember, the sequence of events moves from left to right.
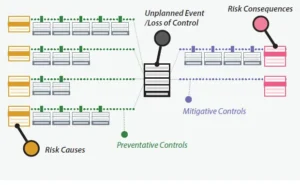
(Figure 2)
To ensure maximum buy-in and long term engagement in the risk management process, your assessment of the likelihood and severity of risk causes and impacts should reflect real-world experience from your business, industry or region. This ensures that the resulting risk probabilities are uniform, and helps to accurately and effectively prioritize risk management resources. The root causes analyses obtained through your incident management activities are a valuable tool for validating risk severity and likelihood. You can also rely on data sourced from other analysis techniques like failure mode, effects & criticality analysis (FMECA), fault tree analysis, ‘5 Whys’ and others.
When it comes time to chart risk impacts, it’s important to anticipate ALL potential and reasonable consequences for a given risk event. Similar to fault tree analysis, event tree analysis offers a systematic method for identifying and analyzing the potential consequences following a risk event. Once the probability and severity of risk causes and impacts are agreed upon, the team can objectively identify and assess the controls needed to prevent or mitigate the risk.
Step 3: Assigning Risk Controls
Once you’ve identified all potential risk causes and impacts, you can then begin developing and assigning the appropriate risk controls to eliminate or reduce them.
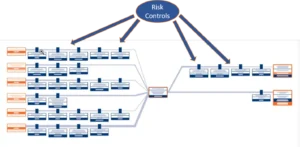
(Figure 3)
Risk controls can include just about anything from engineering and process design improvements to training, work practices, administrative policies and any other measure that acts in some repeatable and reliable way to minimize the likelihood and/or severity of risks.
It can be helpful to categorize risk controls depending upon where they will be located in the bowtie:
- Preventive – risk controls that minimize and/or eliminate the likelihood of a risk event (loss of control) and its subsequent impacts can occur
- Mitigative:
- Detective – risk controls designed to identify, delay or reduce risk impacts.
- Reactive – risk controls intended to mitigate or correct risk impacts once they have occurred
A familiar model to help you select the most effective risk controls for any risk cause or impact is the NIOSH Hierarchy of Controls, which can be seen in Figure 4 below:
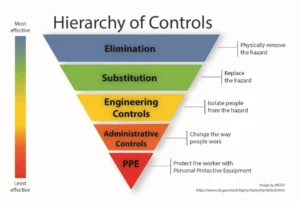
(Figure 4: CDC/NIOSH Hierarchy of Controls)
It’s important that we select and implement the most effective means of eliminating or reducing risk causes and impacts. In particular, we should consider each control’s adequacy, reliability and suitability:
- Adequacy – the extent to which a risk control will reduce the likelihood or severity of a risk cause/impact for all situations defined.
- Reliability – the likelihood that a given risk control will function as expected in reducing or eliminating the risk, and not degrade or fail (see escalation factors).
- Suitability – the extent to which the control’s design is appropriate and accommodates the needs of all users
Be sure to take sufficient time to evaluate potential alternative controls for adequacy, reliability and other key risk indicators (KRIs) in order to select the most effective controls for specific causes and impacts. You should always consider the possibility of implementing multiple controls for individual causes or impacts. Doing so helps to create additive layers of protection against risks.
By assigning controls to the linkages between risk causes and the risk event, and between the risk event and subsequent risk impacts, we are cementing two fundamental aspects of the bowtie’s value:
- a common understanding of how systems/processes work and their propensity to fail
- how controls act to reduce risk, and that they are only as effective as the person/process verifying they will work when expected
These linkages also help to further visualize the causal relationships between bowtie elements, and provide a convenient target for assigning risk controls to individual causes and impacts. In more sophisticated bowtie analysis diagrams, the weight or thickness of the lines will indicate the relative risk level of specific causes and impacts — a broader line signifying a higher probability of contributing to/resulting from the risk event.
Once you have identified the appropriate controls for each risk cause and impact, you can then assign them to an owner and establish a control verification regime.
Step 4: Identify & Control Escalation Factors
After you’ve assigned risk controls, bowtie analysis allows to you to further analyze and control risks by identifying conditions that could negatively affect control reliability. These conditions are called escalation factors.
For example, a fire suppression system (risk control) is designed to help minimize the impact of a fire (risk event). However, the fire suppression system could fail due to poor maintenance or design, leaving the fire to spread uncontrollably. The risk of fire suppression system failure is an escalation factor.
Fortunately, bowtie analysis also allows us to assign controls to individual escalation factors and monitor their effectiveness in minimizing or eliminating those factors, much in the same way as we control risk causes and impacts themselves (Figure 5).
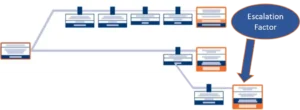
(Figure 5)
Optimizing Your Bowtie Analysis
The fundamental purpose of bowtie analysis is to improve communication and visibility of risk throughout the organization, so what is the best way to document and manage bowtie analysis information so it can be kept up-to-date and made easily accessible to stakeholders?
VelocityEHS Operational Risk solutions include purpose-built bowtie analysis tools that make it easy to identify, track and control risks, then quickly distribute bowtie information to keep your entire organization in sync with your risk management activities. VelocityEHS helps users take simple bowtie analysis, and transform it into a highly sophisticated and agile risk management system with the ability to:
- Construct and modify bowties on a flexible, intuitive virtual canvas that includes drag-and-drop bowtie editing features
- Populate risk causes into bowties directly from your FMECA or other root cause analysis findings
- Perform “what-if” and worst-case scenarios to comprehensively assess potential risk impacts
- Select risk controls from your organization’s control library to help standardize controls across multiple risks, operations and locations
- Set-up and track key risk indicators (KRIs) for individual risk controls to evaluate their effectiveness in reducing risks
- Automatically calculate risk values based on associated causes, impacts and control KRIs for the most up-to-date view of risk across your organization
- Filter bowtie elements to focus on specific causes, impacts and controls
- Quickly analyze and distribute bowtie data with powerful built-in reporting functions
Our customers consistently report that our Bowtie Analysis solution has helped them achieve dramatic improvements to workplace productivity, knowledge sharing and risk management program performance.
For a more detailed look at how bowtie analysis helps to better manage risk, take a look at our Bowtie Analysis blog series.
Ready to see more? Visit our Operational Risk solution to schedule a demo with one of our customer solutions consultants today!