


On March 31, OSHA published the latest injury and illness summary data collected from select establishments subject to electronic reporting requirements under the Recordkeeping Standard. This data for reporting year 2022 joins other data recently issued by the Department of Labor, including Bureau of Labor Statistics (BLS) data for 2021 released in late 2022, as sources of information EHS managers could use to better understand trends in injuries and illnesses. Unfortunately, there’s not much discussion in EHS spaces about the significance of this data and the lessons it may have to teach us. The purpose of this post is to start such a discussion.
In what follows, we’ll review the latest injury and illness data and explain why some trends should be concerning for EHS and business leaders. We’ll also provide some high-level takeaways for EHS managers based on analysis of data trends.
Some Background on OSHA Recordkeeping Requirements
Before we dive into the latest numbers, it’s important to remember that OSHA’s Recordkeeping Standard is the reason why this data exists in the first place. The Recordkeeping Standard applies to establishments with specific NAIC codes within companies that had 11 or more employees at the company level during the reporting year. Employers outside of those NAIC codes or below the company size threshold would be “partially exempt,” meaning they would have no automatic obligation to maintain OSHA recordkeeping forms 300 (“Log of Work-Related Injuries and Illnesses”), 301 (“Injury and Illness Incident Report”) and 300A (“Summary of Work-Related Injuries and Illnesses”) but would still need to directly report several categories of serious injuries and illnesses to OSHA, namely those involving a fatality, hospitalization, amputation, or loss of eye. Partially exempt industries may still need to maintain records if requested by OSHA or the BLS.
In 2016, OSHA published a final rule called, Improve Tracking of Workplace Injuries and Illnesses, that created the additional requirement for certain establishments to electronically transmit injury and illness data to OSHA via an interface called the Injury Tracking Application (ITA).

Establishments with NAIC codes subject to the Recordkeeping Standard with 250 or more employees, as well as establishments in certain high-risk industries with between 20 and 249 employees, to electronically transmit data from their Form 300A summaries to OSHA by March 2 of each year, for the previous year’s injury and illness data. As we’ve blogged about, OSHA has issued a Notice of Proposed Rulemaking (NPRM) that would expand reporting requirements for some establishments to include 300 and 301 data in addition to 300A data, but to-date, there’s no final rule, so we’ll focus on requirements as they currently exist.
There have already been seven reporting cycles, beginning with 2016 reporting year (RY) data that was due at the end of 2017, and most recently, 2022 RY data that was due by March 1, 2023. It’s this latest dataset that OSHA has now released to the public.
Electronic 300A data isn’t the only source of data available to the Department of Labor. BLS also runs an Injuries, Illnesses, and Fatalities (IIF) program, which annually collects data from certain establishments via the Survey of Occupational Injuries and Illnesses (SOII) and the Census of Fatal Occupational Injuries (CFOI). BLS released the latest SOII and CFOI data, for the 2021 reporting year, in late 2022.
Highlights of the Most Recent BLS Data
Let’s start our review on the most recent CFOI and SOII data. The high-level summary is:
- The total reported number of fatal work injuries for 2021 was 5,190, which is up 8.9% from 2020.
- The total reported number of nonfatal injuries and illnesses for 2021 was 2.6 million, which was down 1.8% from 2020.
Note that according to the report, COVID affected the reported numbers of occupational illnesses in 2021 because employers would have needed to record confirmed COVID cases if they resulted in meeting one or more general or specific recording criteria, and if based on the employer’s best investigative efforts, the exposure occurred in the workplace. It’ll be interesting to see how continued waning of COVID cases affect reported numbers of occupational illnesses over the next few reporting cycles.
Let’s dive deeper into fatal and nonfatal injury numbers in the latest BLS data.
Trends in Fatal Injury Rates Compared to Trends in Nonfatal Injury Rates
The chart below from the nonfatal injury report show the rate of nonfatal injuries from 2017 to 2021.
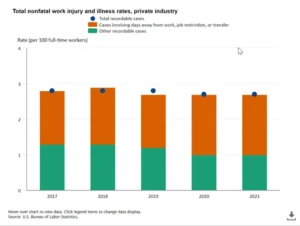
Private industry employers reported 2.6 million nonfatal workplace injuries and illnesses in 2021, a decrease of 1.8 percent from 2020. In 2021, the incidence rate of total recordable cases (TRC) in private industry was 2.7 cases per 100 full-time equivalent (FTE) workers, unchanged from 2020.
It’s useful to work with rates in addition to raw numbers of incidents, because rates are normalized based on employee headcount based on FTE workers. If you don’t normalize based on headcount, you don’t know whether an increase in absolute numbers of injuries or illnesses is due to worsening safety performance or due to just having more employees on the payroll.
In the chart above, you can see that overall recordable cases increased slightly between 2017 and 2018 from 2.7 per 100 workers to 2.8 per 100 workers, remained at 2.8 in 2019, then dipped slightly to 2.7 per 100 workers in both 2020 and 2021. So, one piece of good news is that the rate fell overall between 2018 and 2021.
But you might find less to celebrate if you look at some of the other information in that chart. For example, note the color coding in the bar graphs, in which the orange areas represent rates of days away from work, restricted duty or transfer, and the green areas represent all other recordable cases. When you compare the relative proportions of colors in the charts from 2017 through 2021, you can see the orange area occupies more real estate over time. So, while the total recordable rate may have dropped, the days away, transferred or restricted (DART) rate for more serious nonfatal injuries and illnesses has actually increased.
The charts below from the fatal injuries report show the absolute number fatal injuries on the left, and the fatal work injury rate on the right.
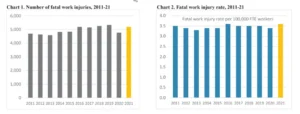
The fatal work injury rate was 3.6 fatalities per 100,000 full-time equivalent (FTE) workers, up from 3.4 per 100,000 FTE in 2020 and up from the 2019 pre-pandemic rate of 3.5. So here again, is a normalized rate for a serious incident—in this case the most serious incident possible, involving loss of life—that increases while the rate for total nonfatal injuries remains constant.
Some other key findings from the latest fatality data include:
- The fatal occupational injury rate of 3.6 in 2021 represents the highest annual rate recorded since 2016.
- A worker died every 101 minutes from a work-related injury in 2021.
- The share of Black or African American workers fatally injured on the job reached an all-time high in 2021, increasing from 11.4 percent of total fatalities in 2020 to 12.6 percent of total fatalities in 2021. Fatalities for this group climbed to 653 in 2021 from 541 in 2020, a 20.7-percent increase, and the fatality rate increased from 3.5 in 2020 to 4.0 per 100,000 FTE workers in 2021.
- Workers in transportation and material moving occupations experienced a series high of 1,523 fatal work injuries in 2021 and represent the occupational group with the highest number of fatalities. This is an increase of 18.8 percent from 2020.
In recent years I’ve sometimes seen BLS injury and illness data summarized with the simple headline “latest BLS data shows a decrease in injury and illness rates” or something similar, and that seems to be one of the industry’s general takeaways from the numbers. But as shown here, a deeper look shows more troubling trends. DART cases represent a higher percentage of recordable cases, and rates for fatal injuries have increased even when nonfatal injury rates declined. It makes no sense to celebrate “improvements” in incidence of overall injuries when rates of the most serious injuries are increasing.
It’s uncertain how much of this disparity comes from under-recording or under-reporting injuries, but we know that both happen. There are good reasons to expect at least some disparity in recording and reporting of fatalities compared to non-fatal injuries, since OSHA has very stringent reporting criteria for workplace fatalities, including the requirement that employers report fatalities within 8 hours, which means, in practice, that a higher percentage of fatalities will be reported compared to nonfatal injuries. That could theoretically explain why a drop in nonfatal injury rates wouldn’t necessarily bring a proportionate drop in fatal injury rates. But that can’t explain the data here, because there’s no reason to expect that disparity in rates of nonfatal and fatal injury reporting would change over time but change over time in reported numbers is what the data is showing. The only plausible explanation seems to be that the pattern is due to actual changes in incidence rates of fatal injuries compared to nonfatal injuries, in which fatal injury rates have increased while nonfatal injuries have decreased.
Another important point to remember here is that under-recording or under-reporting of injuries and incidence rate of injuries are not independent variables. When a company isn’t recording all the injuries it should be, it’s also deficient in identifying hazards leading to workplace accidents, because prevention of future incidents is the primary reason why recordkeeping obligations exist in the first place.
There’s really no way to avoid the conclusion that the latest BLS data is distressing. It indicates that employers en masse aren’t improving their safety culture or their ability to prevent the most serious workplace injuries. Additionally, some populations of workers, such as transportation and material movers and Black American workers, had disproportionately worse outcomes.
Highlights of the Most Recent ITA Data
In a press release accompanying the release of RY 2022 ITA data, OSHA states that the report contains information submitted from over 300,000 establishments subject to electronic reporting requirements.
One of the ostensible reasons that OSHA and BLS release injury and illness data is to help employers understand trends, and associated risks, they should be aware of. As Assistant Secretary of Labor for Occupational Safety and Health Doug Parker states in the news release, “By increasing access to this data, we are providing information that can help people better understand the overall effectiveness of safety and health systems in the workplace.”
That’s all well and good, but data doesn’t speak for itself. The mere possession of a spreadsheet full of raw data doesn’t give EHS managers the take-home lessons they need to prevent occupational injuries and illnesses.
I looked to see if OSHA had compiled or summarized the information received from electronic 300A data submissions for reporting years 2016 and 2022 and couldn’t find anything, so I created a summary myself and am providing it here. You’re welcome.
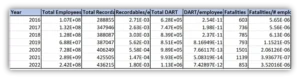
The data in the table includes rates for recordable incidents, DART cases, and occupational fatalities using the total number of employees across all reporting establishments.
There are a few caveats about the limitations of this analysis.. First, the data compiled above is not directly comparable to the SOII and CFOI data discussed in the previous section because the latter data is normalized based on FTE, while the 300A data doesn’t distinguish full-time employees from other employees. And while the number of employees who electronically submit 300A data is of the same order of magnitude (200,000 to 300,000) as the number of establishments included in the SOII and CFOI surveys, because of how applicability works for electronic reporting, there is probably more variability in the establishments that submit 300A data from year to year. For example, because of applicability currently depending in part on having 20 or more employees in specifically listed, higher risk industries, some establishments may drop out of or drop into reporting applicability from one year to the next, and some of these establishments may differ significantly in risk levels and safety performance.
I’d like to call attention to several data trends in this table:
- Total recordable case rates, DART case rates, and fatality rates (all normalized based on numbers of employees) increased from 2016 to 2019. The numbers for all three case types then drop in 2020, reach their lowest point in 2021, and then climb partly back toward their previous levels in 2022. Some of the disruptions brought by the pandemic seem to be at play here. The early stages of the pandemic brought significant headcount reductions in the early stages, but there was then rabid growth of payrolls to near pre-pandemic levels, especially during 2021. I think some of the drop in injury rates in this period may be due to reduction in business activity generally, and some of it might be because the hiring rate in 2021 and possibly late 2020 was significantly faster than the injury rate. In other words, because average injury rates are low overall, periods of accelerated workforce growth will significantly “dilute” the rate.
- During 2016 through 2019, while rates for all three case types increased, the rate for DART cases increased significantly faster than the rate for total recordable cases.
- During the period from 2021 to 2022, when rates for all three cases bounced up from their low in 2021, the rate for DART cases once again increased significantly faster than the rate for total recordable cases increased.
In many ways, this is a unique time in labor history because of the huge changes brought by a global pandemic and its economic impacts, including its effect on business operations and payroll size fluctuations. We’ll need to track this data for a few years as a “new normal” is established to get a fuller sense of where the numbers are going.
Still, the existing data aligns with some of the most recent SOII data in suggestive and disturbing ways. In both cases, DART case rates are increasing faster than rates of other injuries. SOII data additionally shows that between 2020 and 2021, rates of fatal injuries not only increased relative to rates of nonfatal injuries, but even exceeded their 2019 pre-pandemic levels. To put it simply, rates of the most serious injuries are trending the wrong way.
Takeaways from the Most Recent OSHA and BLS Data
The oft-repeated “good news” about injury rates falling isn’t so good when you dig deeper into the numbers. This is especially important to do because EHS managers need to understand the real risks facing their workers and have the appropriate sense of urgency.
Here are some important takeaways based on the most recent BLS and ITA data.
Company Leaders and EHS Managers Need to Focus More on Identifying and Controlling Risks
As alluded to earlier, the latest BLS and ITA data reveals that injuries are trending in the opposite direction to what would be expected if company and EHS leaders were getting better at assessing and controlling major risks. It is in line with what’s expected if many of these same leaders were struggling to overcome reactive safety management cycles, in which they constantly need to put out fires (both figuratively and sometimes literally) and have difficulty shifting to an active approach that effectively controls risks before people get hurt.
Employee Engagement is Crucial to Improving Safety Performance
One of the major challenges for EHS managers is that poor safety performance, including higher incidence of occupational injuries and illnesses, maintains a vicious circle. Employees who know they work in an unsafe environment are unlikely to engage with EHS programs, and their lack of engagement then prevents you from receiving the feedback you need most to improve performance.
You’ll need to fight your way out of this cycle on two fronts. First, you need to identify and control risks, starting with the most significant risks, so that your safety management priorities move out of the reactive phase and start focusing on prevention. Second, you’ll need to make sure your employees know about your efforts and have opportunities to participate in key safety management tasks.
Get the Right Safety Tools
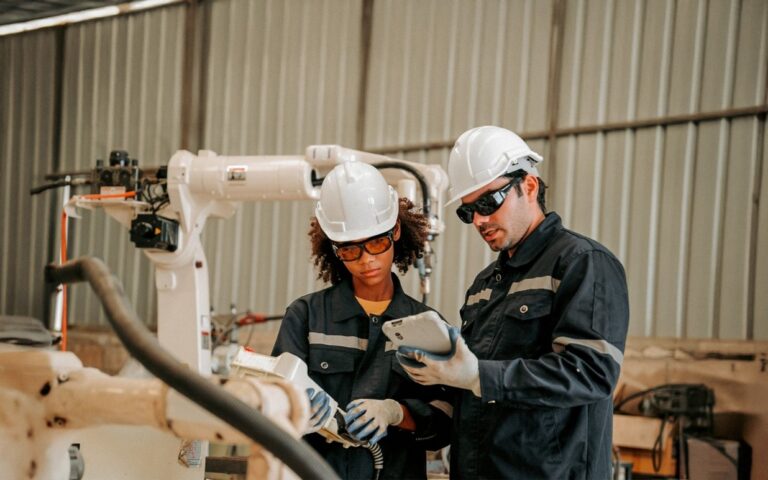
Of course, making the right improvements is often easier said than done, because many EHS managers lack efficient ways to complete their core safety management tasks, or to share responsibilities with other employees. Modern EHS management software can help here. For example, our VelocityEHS Safety Solution includes easy-to-use incident management capabilities that help you and your entire workforce easily start reports on occupational injuries and near hits/near misses, and record safety observations, with ability to attach documentation such as site photographs directly to the report. Analytical tools within the software then help alert you to patterns in injuries, so you can prioritize your attention and prevent occurrence of similar future incidents. You can also easily initiate corrective actions and involve front-line workers in their development, assign and prioritize follow-ups, and perhaps most importantly, share progress on corrective actions with workers. Employees who directly participate in your safety program and see the progress with their own eyes will be more likely to believe that their involvement makes a difference, and to participate in the future.
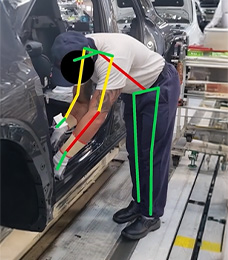
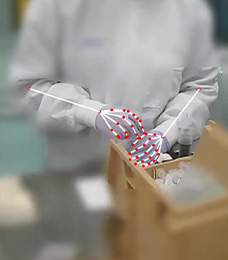
You can also improve your safety performance by focusing on ergonomics. Because ergonomics is about fitting the job to the worker (rather than the traditionally more common, and very problematic, practice of forcing workers to adjust to the nature and demands of work designed without safety in mind), it’s a great first line of prevention against injuries, especially musculoskeletal disorders (MSDs) from strains, repetitive motions or overexertion. Common ergonomics assessment challenges include determining if you’re evaluating the right job tasks, and whether you’re accurately measuring body angles and force exertions. Our VelocityEHS Ergonomics solution simplifies this through powerful artificial intelligence (AI) that lets you record and analyze employee physical motions as they perform job tasks. From there, embedded expertise within the software helps identify root causes and associated corrective actions. It’s not just assessment –it’s intelligence that helps you identify the most important areas for focused improvements and manage the process, so you can reduce incidence of MSDs.
Taking a wide view, all the facets of safety management discussed in this article boil down to operational risk management. For example, the BLS and ITA data indicates that business and EHS managers aren’t focusing on the most serious risks that lead to DART and fatality cases. EHS managers often struggle with risk management because there are many types of risk assessments, and it can be difficult to condense information from multiple assessments into a form that employees can understand and use in their day-to-day job tasks. The Velocity EHS Operational Risk solution helps there, especially through its risk bowties functionality, which pulls risk information from many different assessment types into an intuitive, easily understood map of risk pathways that can be shared with employees. It’s also quick and easy to update risk bowties as operations or risk management practices change, so workers will always have the latest information they need.
Let VelocityEHS Help!
This article only outlined some of the ways the VelocityEHS Accelerate ® Platform can help you. Visit our Solutions page and request a demo today to find out more about how VelocityEHS can help you be safer and more sustainable. And don’t forget to check back on our blog frequently and be sure to follow us on LinkedIn for the latest updates on EHS and ESG.