


By Phil Molé, MPH
OSHA recently shared its latest dataset of employer injury and illness records, containing statistics electronically submitted to OSHA via the Injury Tracking Application (ITA). The most recent data, for reporting year 2024, includes important information about numbers of overall occupational injuries and illnesses, as well as data on more severe incidents involving restricted duty and days away from work (DAFW). Still, it’s a lot of data, and it’s not necessarily easy draw insights, but today’s your lucky day, because we’ve done just that!
In what follows, we’ll break down some of the major trends from OSHA 2024 injury and illness data and leave you with some takeaways you can use to improve safety management.
The Background of OSHA’s Injury and Illness Statistics
It might be helpful to start with some background on injury and illness data, and how OSHA collects it from employers.
History and Purpose of the Recordkeeping Standard
The OSHA Recordkeeping Standard goes back to 1971, making it one of the earliest regulations issued by OSHA. The standard requires many US employers to maintain records of work-related injuries and illnesses that meet general or specific recording criteria. Specifically, employers covered by the Recordkeeping Standard need to complete and maintain three forms:
Form 300 (Log of Work-Related Injuries and Illnesses): This is the main record of workplace injuries and illnesses. It contains details about each incident such as the employee(s) involved, a classification of severity (e.g., whether it involved restricted duty or days away from work), and the number of days away from work or restricted duty work, if applicable.
Form 300A (Summary of Work-Related Injuries and Illnesses): This is a form that employers covered by the Recordkeeping Standard need to complete and post annually for the previous year’s injury and illness data. The 300A contains only summary-level data (i.e., there are no details about individual cases) such as the number of recordable incidents, the numbers of restricted duty and days away from work cases, and the numbers of specific incident types, like hearing loss cases. The employer needs to complete, sign, and post a copy of the 300A in an accessible location by February 1 of each year, and keep it up until April 30th.
Form 301 (Injury and Illness Incident Report): The employer needs to complete Form 301 for each individual recordable injury and illness that occurs. The purpose of Form 301 is to capture more details about the incident—whether an emergency room visit or other medical treatment occurred, and the causes of the incident—so the employer has the information needed to prevent recurrence.
The details about information in Form 301 help us understand why OSHA prioritized issuing the Recordkeeping Standard so early in their history as an agency—they know that employers need an accounting system for workplace injuries and illnesses, so they can have the data needed to focus on prevention. OSHA also needs employee injury and illness data to assess which industry sectors seem to have elevated risks of injuries. This helps them determine the potential need for new regulations and evaluate how well current regulations are doing.
For many years, OSHA collected information from select employers through the Bureau of Labor Statistics (BLS) survey, or via the OSHA Data Initiative (ODI) program. This process was time-consuming and inefficient, which eventually led OSHA to consider more direct ways of receiving employer injury and illness data.
OSHA’s Electronic Injury and Illness Reporting Rule
OSHA issued a 2016 final rule requiring employers at some establishments to directly submit injury and illness data (specifically, electronic 300A data) to OSHA via a new web interface called the Injury Tracking Application (ITA). In 2023, OSHA revised electronic reporting requirements, and as a result, some establishments must also now electronically report data from Forms 300 and 301.
OSHA eventually began publishing employer-reported data on their website, with the goal of making the data more available to help employers and EHS professionals understand broader industry trends in injuries and illnesses. This brings us right up to the present, and OSHA’s release of 2024 employer data.
Total Reported Injury and Illness Cases for 2024
Let’s dive into the numbers, starting with total reported injuries and illnesses in reporting year 2024.
U.S. employers reported roughly 1.5 million work-related injury and illness cases for 2024. About 90% of these cases were injuries (the rest were illnesses), which marks a return to a pre-pandemic balance due to COVID-related illnesses subsiding.
The Departments/Roles Most Affected by Injuries and Illnesses in 2024

Figure: Top 5 sectors by total reported workplace injuries in 2024 (OSHA 300A data).
Healthcare and social assistance workplaces reported the highest number of injuries in 2024, reflecting the physical demands on caregivers and medical staff. This sector saw 308,000 injuries, the most of any industry. Transportation and warehousing came next (232,000 cases), followed by manufacturing (220,000) and retail trade (195,000). Construction, while lower in total cases (~65,000), still represents a significant injury count.
These findings align with long-standing data showing healthcare, transportation/warehousing, and manufacturing jobs have among the highest rates of injuries, including musculoskeletal injuries. The occupations most prone to such injuries include nursing assistants, freight and stock movers, and other laborers who perform frequent lifting and manual material handling.
Most Common Categories of Injuries and Illnesses
The chart below shows the most common categories of injuries and illnesses as reported in the 2024 OSHA injury and illness data.

The most common categories, from left to right, are respiratory conditions, hearing loss, skin disorders, poisonings, and deaths.
These categories don’t represent all possible types of injuries and illnesses, because they come from the category selections made by employers on Form 300A. However, the data reveals that a large number of work-related respiratory conditions were reported in 2024.
Respiratory illnesses in the workplace often result from exposure to occupational stressors such as particulate matter or chemical vapors, so the high number of these conditions points to a need for employers to take a more active role in assessing and controlling these exposures through industrial hygiene sampling. To run an effective IH program, employers must first have visibility of which chemical products in the workplace have established occupational exposure limits (OELs). Chemical management software that includes regulatory flagging capabilities alongside ingredient indexing services can provide employers with the visibility they need of chemicals with OELs in their inventory, so they can conduct sampling needed to measure and then reduce exposure levels and reduce numbers of respiratory illnesses.
Injury Severity and Outcomes
Top Industries by Restricted Duty Cases
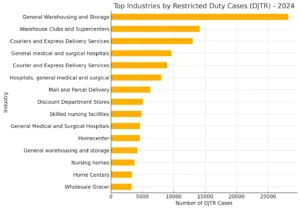
Warehouses, clubs and supercenters came in first, followed by couriers and express delivery services, and general medical and surgical hospitals.
There are some characteristics of these jobs we can identify that contribute to higher numbers of restricted duty cases, including:
Lifting/material handling: Warehousing jobs involve a great deal of material handling, such as putting packages on or off of delivery trucks, and moving materials on and off of storage shelves. There’s significant potential for strains and overexertion in these tasks, especially because of the larger, more awkward package sizes and shapes and the common lack of optimal material handling equipment.
Transportation/vehicle related accidents: Courier and warehousing/distribution jobs involve a great deal of driving, often to unfamiliar locations. There are external factors beyond the driver’s control, including the weather, the condition of roads, and the behavior of other drivers.
Top Industries by Days Away from Work (DAFW)
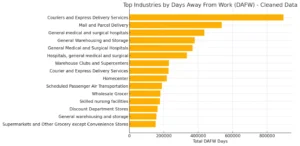
There are some additional insights we can get from a side-by-side comparison of the highest numbers of restricted duty cases and DAFW cases, by industry, as shown in the chart below.

In general, we see that the same industries with high numbers of restricted duty cases also have high numbers of DAFW cases, which isn’t surprising, since the high level of risk in these industries makes serious injury and illness outcomes more likely. In most cases, industries have fewer DAFW cases than restricted duty cases, but the number of DAFWs for the courier and express delivery sector is actually higher than the number of restricted duty cases, and the number of DAFW cases in the scheduled passenger air transportation sector is almost as big as the number of restricted duty cases.
As previously mentioned, industries that involve significant time driving come with elevated risk levels due to the varied environments drivers must navigate and the lack of control over external factors, such as road and weather conditions.
Top Industries by Number of Fatalities
The chart below shows the top five industry sectors by numbers of reported fatalities, according to the OSHA 2024 injury and illness data.

The most common industry sectors, from left to right, are transportation and warehousing, construction, manufacturing, public administration, and administration/support and waste management remediation services.
There’s some overlap, as we’d expect, between the sectors that have the highest number of fatalities and the sectors with the highest numbers of restricted duty and DAFW cases. For example, the transportation and warehousing sector appears near the top of all those lists, for reasons already discussed.
Interestingly, though, we also see industries in the top five for fatalities that were not among the top industry sectors for DAFW and restricted duty cases. The construction industry is an example, because it came in second in overall fatalities. This datapoint tells us that there are many severe unassessed and controlled risks in the construction industry, because it has a higher proportion of injuries that result in the most severe outcome (fatality) rather than restricted duty and DAFW cases. This result highlights the importance of a proactive approach to safety, focused on identifying, prioritizing and controlling risks.
Musculoskeletal Disorder (MSD) Injuries
MSDs are injuries to joints, ligaments, muscles, nerves, and tendons caused by overexertion or awkward motions. Because MSDs are both common and commonly overlooked by employers, it’s useful to spend some time analyzing insights about MSDs we may be able to get from OSHA’s most recent dataset.
While the OSHA 2024 injury and illness data does not explicitly identify MSDs among the injuries (because there’s no category box to check for them on the 300A), it’s still possible to reach some general conclusions about the prevalence of MSDs based on the 2024 employer-reported injury and illness data.
For example, there is data available showing that nearly one-third of serious workplace injuries involve musculoskeletal disorders (sprains, strains, back injuries, etc.) In other words, ergonomic-related injuries are the single largest category of workplace injuries. This underscores how common strains and sprains are on the job.
Causes and Contributing Factors for MSDs
Work-related MSDs and sprain/strain injuries usually stem from ergonomic stressors on the job. Some common causes include:
- Overexertion in Lifting/Moving: Carrying or lifting heavy objects (or people, in healthcare) puts tremendous strain on workers’ backs and shoulders. Overexertion injuries—such as lifting beyond one’s capacity—have historically been the #1 cause of workplace injury costs.
- Repetitive Motions: Tasks that involve repeating the same motion (assembly line work, typing, tool use) can lead to chronic injuries like carpal tunnel syndrome or tendonitis. Even if each motion is low force, the cumulative effect causes wear on muscles and joints.
- Awkward Postures & Fatigue: Working in bent, twisted, or otherwise awkward positions (e.g. stretching overhead, stooping frequently) contributes to sprains/strains. Lack of ergonomic workstation setup or insufficient rest breaks can exacerbate this, as tired muscles are more injury prone.
These factors often interact. For example, a worker who is both fatigued and lifting awkwardly is at especially high risk of injury. The data reinforces that many jobs (from warehouse loading docks to hospital wards) impose these risk factors daily.
Severity of MSDs
Ergonomic injuries are not only frequent, but they can also be severe in their impact on workers’ health and productivity. In 2024, over half a million cases were serious enough to involve days away from work and an additional ~410,000 cases required job restrictions or transfers (light duty) instead of usual work. These serious injuries resulted in a staggering 18.5 million days of lost work (and 22.4 million days of restricted duty) in a single year.
The human toll is significant: an injured employee may endure pain, recovery time, and lost income, while their colleagues face the strain of understaffing. The business impact is also substantial. Lost workdays and workers’ compensation costs from MSD injuries run in the billions of dollars. In fact, MSDs cost U.S. businesses an estimated $18 billion annually in direct costs (medical treatment, comp claims, etc.), not including indirect costs like reduced productivity or training temporary replacements. This highlights why organizations are investing in ergonomics—preventing a single bad back injury can mean avoiding tens of thousands of dollars in costs and keeping an experienced worker on the job.
One notable trend is the focus on prevention programs: many industries with high MSD rates (like healthcare and logistics) have started implementing lift-assist equipment, ergonomics training, and fatigue management. Of course, implementing effective ergonomics programs depends on being able to complete accurate MSD risk assessments and using insights from those to implement effective corrective actions. Look into the ways that modern ergonomics software can help you more easily complete and use your ergonomics assessments so you can reduce MSD risks, and the high human and financial costs associated with them.
Takeaways for EHS Professionals from the OSHA 2024 Injury and Illness Data
Here are some key takeaways from the OSHA 2024 injury and illness data.
Understand the risks of your industry sector
One of the reasons that OSHA issued the Recordkeeping Standard in the first place is to collect data about injury and illness trends in specific sectors, because the agency always knew that certain industries inherently had more significant risks because of the nature of work conducted.
Since OSHA started directly collecting employer data through the ITA, the numbers have clearly borne out this fact. For example, the 2024 data shows that the medical industry and the warehousing sector have higher numbers of restricted duty cases, and the refrigerated warehousing sector has DAFW rates much higher than those of the closest runners-up.
Awareness of the injury and illness risks for your sector is an important prerequisite for building safety management maturity. You can use this knowledge to create more tailored inspection checklists to help you home in on industry-specific risks at your facility, so you can quickly develop and assign corrective actions to address identified hazards.
Focus on Preventing Respiratory Illnesses
The OSHA 2024 injury and illness data shows that respiratory illnesses were the single most commonly reported among the categories included on the 300A. Employers need to more actively identify chemical ingredients in their products that have established OELs so they can sample for these chemicals in their IH programs, and collect the information needed to reduce the exposure of their workers to harmful levels of airborne chemicals. Chemical management software can give you visibility of your inventory at the ingredient level, with regulatory cross-referencing capabilities to help you easily identify the chemicals you need to prioritize including in your IH program.
Don’t forget ergonomics!
Many employers underestimate the number and severity of MSD risks in their workplace and haven’t yet implemented a full ergonomics program. As a result, they’re putting their workforce at significant risk of MSDs, which can be costly not only in terms of the human toll on employees and their families, but also in terms of lost productivity and workplace morale. In fact, while the 2024 injury and illness statistics don’t explicitly delineate the contributions of MSDs to injury totals, we know that MSDs are an important factor behind the high injury rates in some industries, such as the DAFW numbers for the refrigerated warehousing sector.
Look into more effective ways to conduct ergonomics assessments, such as using 3-D motion capture software that you and your team can deploy from anywhere via a mobile device. Make sure the software you’re considering also has built-in expertise that helps you accurately identify root causes and select appropriate controls, so you can actually use your assessment results to reduce MSD risks.
Focus on injury and illness prevention
Effective EHS managers shift from a reactive approach to safety management to a proactive approach. In other words, instead of their safety program focusing on investigating and documenting injuries that already happened, it’s graduated to preventing the injuries that could happen, while prioritizing addressing the most significant risks.
There are a few key ingredients for success in this more mature management approach.
The first is that you need good injury and illness data, which means that you need to be sure you’re learning about, investigating and documenting all workplace injuries and illnesses. Another is that you need insights into your data, like visibility into patterns of injuries, including specific injury types, locations of injuries, and common root causes.
Make sure you’re in compliance with OSHA electronic reporting requirements!
In the midst of reviewing all this 2024 injury and illness data, it can be easy to forget that it’s only available because OSHA’s Recordkeeping Standard requires some employers to electronically submit injury and illness data to OSHA via the ITA. Make sure you know if these requirements apply to you. If they do, make sure you’ve submitted the required electronic reports to OSHA. It’s more important than ever to make sure you’re in compliance, because OSHA’s most recent Site-Specific Targeting Program (SST) prioritizes OSHA enforcement inspections at establishments covered by electronic reporting obligations that did not submit the required injury and illness data. Of course, it’s also only possible to submit digital injury and illness records if you’re correctly recording incidents and completing OSHA Forms 300, 300A and 301 in the first place.
Maintaining compliance with OSHA’s ITA submission requirements (and being able to document compliance) is easier with the right support. Look into safety management software that helps you and your team quickly and accurately complete incident investigations and generate Forms 300, 300A and 301. The best safety management software even helps you quickly generate a file containing electronic injury and illness data for all your establishments covered by ITA reporting obligations for fast, easy submission to OSHA.
Let VelocityEHS Help!
Our Safety Solution has incident management capabilities that can help you meet your Recordkeeping requirements, with mobile incident reporting and the ability to quickly attach photographs and other documentation to the inspection record. We also help you easily complete Forms 300, 300A and 301. Best of all, we make it easy to generate electronic versions of all three OSHA forms for easy transmission to OSHA via the Injury Tracking Application (ITA). And if you have reporting obligations for multiple establishments, you can cut down on reporting time by putting information for multiple establishments on a single .csv file.
Our Industrial Ergonomics software helps you ensure that you’re not ignoring MSD risks. You’ll get our industry-recognized 3-D motion capture, which provides the most comprehensive MSD risk assessment available, incorporating automatic scoring of wrist bending and back twisting, and even capturing data from hidden body segments. You’ll also be able to use your assessments better to reduce MSD risks, because the insights and experiences of our own board-certified ergonomists are baked into the capabilities. This helps you more accurately identify root causes and select effective corrective actions.
Finally, our Chemical Management software provides detailed insight into your chemical inventory at the ingredient level, along with regulatory indexing capabilities to help you identify chemicals with established OELs. This provides you with the information needed to reduce the risk of respiratory illnesses in your workplace.
All of these software capabilities are part of our VelocityEHS Accelerate® Platform, alongside our best-in-class Operational Risk software. With Accelerate®, you’ll have one software platform to manage it all, with a unified user experience via a single sign-on. Contact us today to learn more about how we can help you build safety management maturity and protect your workforce.