At our recent virtual conference, VelocityEHS expert Dana Garber, Senior Solutions Strategist, presented a case study about an incident at a theme park in Australia that resulted in the deaths of four adults. Dana presented the details of this occurrence using a bowtie analysis, which involves identifying hazards and potential mitigation techniques. The bowtie diagram can be used to help prevent incidents like this from occurring in the future.
Here is a quick summary from Dana’s session.
Why Process Safety Events occur
- There are many systems or barriers in place to prevent a hazard from becoming an incident.
- Process safety incidents are usually a result of multiple barriers failing.
- If the flaws or weaknesses in each barrier line up, the hazard can become an incident.
Therefore, an efficient safety management system ensures that barriers are available on demand. A great example is a bowtie diagram.
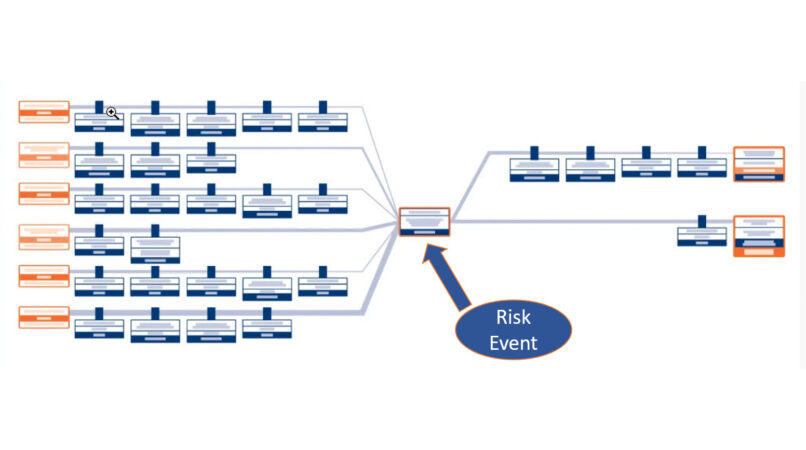
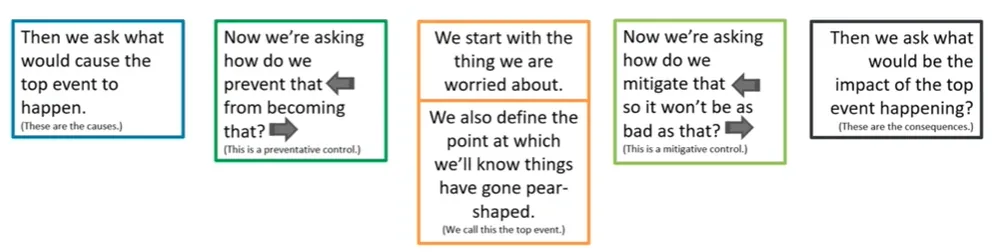
Bowtie diagrams are based on the idea of causality, and they operate on a left-to-right basis. To build a proper bowtie story, the following steps must be taken:
- The issue that is of concern (top event) is placed in the middle, as shown in the image below.
- The causes are then placed on the far-left side, and the associated consequences are placed on the far-right side.
- The preventative measures are placed in between the top event and the causes, while the mitigative measures are placed between the top event and the consequences.
Using the Bowtie Analysis to Break Down the Thunder River Rapids Tragedy
On the day of this incident, the water level that sustains the ride dropped significantly below the required threshold, which started a chain of events that culminated in the unfortunate death of four individuals. The economic fallout from this incident included numerous internal consequences such as a 50% drop in overall share price of the park between 2016 and 2018, as well as fines of more than $4 million. This incident can be further analyzed using a bowtie diagram. Watch the recording to listen to Dana’s breakdown of the incident!
Here are a few additional points to consider when building a bowtie diagram:
- Identify escalation factors for critical controls. Like any implementation in any process, mitigative and preventative controls can fail. However, it is possible to identify, and therefore prepare, for what can cause these controls to fail. For instance, in this incident, a preventative control for this ride could have been building the ride to meet industry standards. The fact that the ride was custom-made and built in-house (as opposed to using industry standards) is an escalation factor, thereby rendering the preventative control less effective. Escalation factors identified quickly are useful in validating preventative and mitigative controls.
- Repeat process for all causes and consequences. To have an effective and exhaustive bowtie diagram, multiple causes and consequences should be identified. This helps you be as prepared as possible. Escalation factors should be identified for all causes and consequences, specifically for the preventative and mitigative controls. A proper diagram would ease the process of analyzing the risks associated with the concern that could be qualified and quantified. The frequency or severity of these risks could then be greatly reduced or eliminated.
What does Better Risk and Control Management Look Like?
It is ideal to have as many causes and consequences identified as possible. As a result, more escalation factors are considered. This ultimately means better preparation for potential issues within the system. The more factors that are identified, the easier it is to identify the more critical controls that require the greatest attention.
Depending on the system analyzed, there may be lower risk of adverse consequences. Including more quantitative analysis can result in even greater improvements to the system.
Overall, it is not possible to identify every control, but it is important to recognize the most critical ones. Use the bowtie analysis to better understand which control affects risk and if there are trends that must be observed and addressed.
Session Q&A
Q1: Can you explain escalation? I’m not sure I understand what that is in a bowtie analysis.
A1: Escalation is essentially the effectiveness of a control, analyzing it by an escalation factor. What would cause a mitigative or a preventative control to fail? This is important to consider in order to determine the strength of the control and to ultimately improve a system by reducing risk.
Q2: What bowtie tools are available for download (free or paid)?
A2: VelocityEHS Risk, BowtieXP, and BowTiePro are paid software services that offer bowtie analysis and diagram building options. However, bowties can be created using Microsoft Visio or any chart building tool (it just requires much more effort from the user).
Q3: How does the calculation work with the bowtie (manual) or bowtie software (automated)?
A3: It depends on your needs. You can start off qualitatively with a risk matrix, but if you have data from a numeric standpoint, you can quantify reduction and then go across the board until you get a final value. Software can also do this automatically.
Q4: Did you notice the chemical incident sending dozens to the hospital from the Six Flags Hurricane Harbor Splashtown in Spring, TX, a few days ago?
A4: Not yet. As a frequent chemical safety board website visitor, I’m confident it will show up there, or in the news, soon. It looks like a case of unintentional chemical mixing between sulfuric acid (used to adjust the pH levels in swimming pools) and chlorine bleach (disinfectant cleaner), resulting in chlorine gas, which was used as a weapon in World War I.
Q5: The bowtie reminds me of A3’s and the 5 Whys. Is this similar?
A5: Bowtie diagrams/assessments take many forms, Bowties are just a visual format. Users could perform anything from A3 to complex Layer of Protection Analyses (LOPA) using bowtie software! Stay tuned to VelocityEHS blogs to learn how to perform different assessment types in the bowtie format.
Q6: Can bowtie analysis be combined with any RCA techniques? What can kind of incidents/events/process can have bowtie analysis?
A6: Yes, it can; bowtie analysis is very suitable for RCA. With RCAs, it is all about going back to figure out additional causes, essentially going the opposite way that bowtie analyses tend to go. Register to attend our Risk Management training course in September!
Q7: Do you do all of this own your own or as a group or committee?
A7: When bowtie analyses are performed, they are almost always done in a large group with every stakeholder involved (engineer, maintenance, safety), and they tend to last a while. It is a discussion; it progresses from a meeting where people talk to one another about how a bowtie diagram is built. The expertise contributed from different departments is crucial to make it exhaustive.
Q8: How are you assigning risk? When are you assigning it? Is this done with group of people?
A8: Like Q7, when risk is qualified, the next question is “How likely is it?” Depending on the software or system, the risk can be quantified. Another method of assigning risk is based on whether it has occurred before and how long ago or how frequently it occurred in the past. The likelihood of the cause and the severity of the outcome are crucial; everything else can be analyzed qualitatively or even semi-quantitatively. Software can easily do this, but our recommendation is to determine these across the company and define them to make the risk assessment process easier.
Q9: How would you break this down for an office worker who works both from home and in the office throughout the week? I see the value in this instance, but it seems more complicated than is necessary for an office worker’s risk analysis.
A9: If we are doing the risk analysis in a workplace, it could be a simple bowtie. What are the consequences of an ergonomic irregularity? Incorrect posture that could result in injury. What would cause the incorrect posture? The chair that is being used or the chair height. What controls are in place? Possibly change to an “ergonomic” chair or a different monitor. A mitigative control could be to evaluate the office workspace before the injury occurs (check out VelocityEHS Office Ergonomics) before the problem results in an injury. Any case with all of these factors can easily be viewed with a bowtie diagram.
To view the on-demand recording of this session, or the other sessions presented during the CEU conference, visit the VelocityEHS website.