


By Phil Molé, MPH
Welcome to the second and final installment on EHS reporting and dashboards. In Part 1 of our series, we talked about the historical challenge of reducing rates of serious injuries and fatalities (SIFs), why potential SIFs (PSIFs) make great leading indicators, and how purpose-built AI for EHS software enables EHS professionals to finally track PSIFs at scale.
In Part 2, you’ll learn about the value of dashboards for helping you access data on PSIFs and the return on investment (ROI) associated with prevention. You’ll also understand the advantage of integrating PSIF-related data with other useful EHS metrics, including actions, root cause analysis, and incident trends.
The ROI of Addressing PSIFs
In the previous blog, you learned how AI enables faster and more accurate identification of PSIFs and about the major positive impact this has on safety performance. Another huge benefit of addressing PSIFs comes from avoided costs associated with major injuries.
There are two main sources or pillars of potential costs associated with PSIFs: safety and compliance, and operational continuity.
Safety and Compliance
This broad category includes two related subcategories. Safety costs include both the direct costs of the injury, including medical treatment, and indirect costs, such as lost productivity.
There are many sources of information about injury costs. For example, OSHA’s Safety Pays Program maintains an online Individual Injury Estimator that lets users input various details about a type of injury and then shows total estimated costs as well as estimated additional revenue the company would need to offset those costs. National Safety Council (NSC), which has been collecting and publishing injury and fatality data since 1913, maintains an Injury Facts database that’s become a trusted source for statistics on many aspects of injuries, including preventable injury-related costs paid by employers and government.
Compliance costs include fines and penalties from regulatory agencies, such as OSHA in the U.S. Not every SIF involves a violation of a regulatory obligation, but many do, and companies with higher rates of SIFs are likely to be out of compliance. For example, OSHA investigations of companies that have had fatalities often find breaches of requirements for regulations on machine guarding, hot work, and other highly hazardous job tasks.
When you consider that OSHA’s Recordkeeping Standard requires employers to report injuries involving loss of life within eight hours and hospitalizations, amputations or losses of eye within 24 hours, and factor in that the agency prioritizes facilities with SIFs for inspection, it’s clear that facilities with SIFs have much greater potential for enforcement visits from OSHA.
Even if an organization did not receive violations or associated fines with a particular SIF, it still may have legal costs. There are several ways this can happen. Even though worker’s compensation laws exist to limit employer exposure to lawsuits, employees can still directly sue employers under some circumstances, such as in cases of gross negligence or willful misconduct, or cases in which employees allege being targeted for retaliation for reporting injuries.
Employees may also raise claims under disability laws like the Americans with Disabilities Act (ADA) in the U.S., for instance, over disputes on return-to-work conditions or work accommodations. Finally, companies often incur legal fees for counsel retained when contesting citations by regulatory agencies or negotiating settlements.
Operational Continuity
In simplest possible terms, operational continuity means that your facility and all its operations keep running. It’s about avoiding downtime due to major accidents.
SIFs don’t just impact individual workers as devasting as these effects can be. They can also disrupt or even halt core business operations. For example, companies where SIFs occur may need to shut down and close off work areas during the investigations, whether conducted internally or by enforcement agencies. Regulatory authorities may even issue stop-work orders, pending further notice. Entire lines, or even entire facilities, may go offline, especially in high-risk industries. SIFs may also involve severe facility/equipment damage, which even in the absence of partial or full facility shutdowns, will at minimum reduce production activities.
Continuity can also suffer indirectly, in the aftermath of a SIF. Missed production targets can cascade to affect customers and value chain partners, jeopardizing those relationships, which in turn jeopardizes the company’s business health. The negative publicity that comes with SIF also brings reputational risks, which can sour chances of getting loans and investment dollars.
On the other hand, reducing PSIF risks is a way to maintain operational continuity and build business resilience. Using incident management software that facilitates not only the identification and tracking of PSIFs, but visibility into avoided costs, can help you achieve the visibility needed to achieve that.
Why Should Safety Professionals Care About Costs?
Before we move on from our discussion of costs, let’s address a potential objection. There are some out there who might read all this talk of avoided costs and ROI and strenuously object. They might say that keeping people safe shouldn’t be about counting dollars and cents and might even claim that no EHS professional worth her salt should be motivated by or even care about the financial calculus of safety management.
Let’s put this objection in the best light. Yes, it’s true that the health and safety of our people is worth so much more than money can ever measure. And it’s true that in an ideal world, money would be no deterrent to doing what we should do, or even need to do, in safety management, or for the benefit of people more generally.
But we don’t live in that world.
We live in a world where every department must fight for its budget, and stakeholders demand proof that every dollar spent supports the company’s bottom line. We also live in a world where, sadly, many companies have historically cut corners on EHS management precisely because it boosted their profits to do so. That was one of the major points of Upton Sinclair’s The Jungle (1906), an investigative exposé of the meatpacking industry of the early 20th century, with its major safety hazards, exploitation of labor, and food quality issues that put consumers at serious risk. It was also one of the themes of Rachel Carson’s Silent Spring (1962), which explains the economic incentives driving widespread pesticide use, and the catastrophic effects it was having on ecosystems.
In fact, the profitability of doing the wrong things is one of the problems that regulations exist to solve. Regulatory agencies don’t just tell companies what they can and can’t do and hope company leaders will follow the better angels of their nature. They use fines as one of their primary enforcement methods.
The point of fines is to change the economic incentive structure in which companies operate, so that it’s no longer profitable, or at least not as profitable, to sacrifice human health and the environment for greater profits. That’s why every global regulatory agency has fines in its toolkit, and it’s why, for example, OSHA has been inflation-adjusting its fines every January in recent years to ensure that the penalties keep their deterrent power.
Anyone maintaining that costs shouldn’t matter to EHS professionals should direct their argument to OSHA and NSC because both organizations clearly believe there are good reasons behind their efforts researching and publishing data about injury costs. For that matter, those holding this position should raise their objections with any regulatory agency because agencies globally use fines to disincentivize EHS compliance violations.
In either case, the objector would most likely get a response like the one laid out here. Wishes and ideals aside, money matters in EHS management because it matters in the world, period. It’s part of the complex web of motives and incentives that EHS professionals must navigate to achieve their primary objective of getting everyone home safely every day.
Tracking PSIFs on Dashboards
So far, you’ve learned about the value of tracking PSIFs and the measurable ROI associated with addressing them. But to harness the real value of PSIFs as a leading indicator, you not only need to have the data, but also be able to access and use the data to improve safety.
Reporting and dashboards are crucial for this purpose.
If PSIF metrics live only in isolated assessments or safety team analyses, they rarely influence day-to-day decisions. Incorporating PSIF indicators into regular reporting and executive dashboards ensures that these high-consequence risks are visible alongside production, financial, and operational metrics. That visibility changes the conversation; leaders begin to evaluate performance not just on efficiency or output, but on exposure to catastrophic risk.
Embedding PSIF data into dashboards also helps organizations prioritize what matters most. Traditional lagging metrics like total recordable incident rates can obscure low-frequency, high-severity risks.
By contrast, PSIF-focused reporting highlights weak signals, such as high-risk exposures, control failures, or near misses, which are more predictive of serious outcomes. When organizations review and discuss these indicators at leadership levels, they’re better positioned to allocate resources, intervene earlier, and prevent life-altering events. In short, integrating PSIFs into reporting turns insight into action, making safety not just measurable, but truly manageable.
Integrating PSIFs Into A Robust Program of Incident Leading Indicators
To make the most progress toward a preventive safety management approach, you need to integrate the tracking of PSIF risks into a robust metrics ecosystem, alongside other valuable leading metrics. Here are some of the other types of metrics, with a focus on leading indicators, to prioritize tracking.
Root Cause Analysis
Root cause analysis (RCA) is the process of looking for underlying, systemic reasons why an unplanned incident, including an occupational injury, illness or accident, has happened. The term systemic is key because it highlights that true RCA looks at aspects of the management system, such as programs, policies, risk assessments, or training when determining the causes of an incident. Here, it’s useful to remember the definition of a root cause used in incident investigation guidance published by Health & Safety Executive (HSE) in the UK:
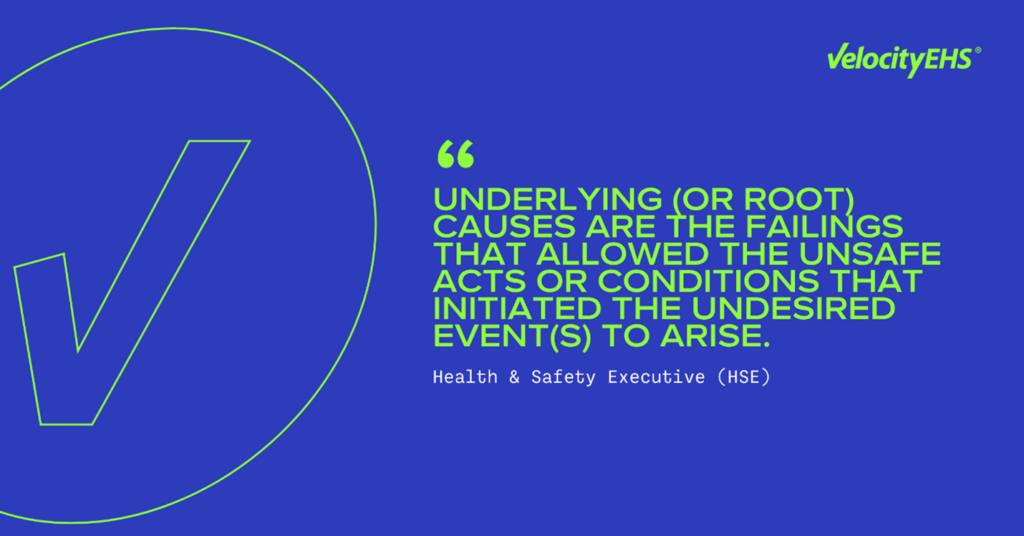
Further, Health & Safety Executive (HSE) indicates, “Underlying causes should be explored fully as they usually arise from organizational or safety management systems failings.” National Examination Board in Occupational Safety and Health (NEBOSH), a UK-based organization that provides globally recognized qualifications in occupational health and safety (OH&S) and risk management, also uses the HSE definition, while adding that a root cause is “the failure from which all other failings grow, often remote in time and space from the adverse event.”
That last part is important to remember because there’s no rule that hazards must lead to accidents and injuries quickly. Risk is based on probability and absence of incidents does not mean absence of risks. By the time an accident happens, and you identify its causes from RCA, those hazards and risks have probably already been living rent-free in your workplace for quite some time.
In other words, it’s very important to get RCA right because you’re looking for underlying causes, so you can address them and prevent recurrence. It’s not just a box-checking exercise, because mistakes in RCA will cascade to mistakes in choosing actions to mitigate the risks of identified root causes. Unfortunately, the urgency to complete an incident investigation often causes personnel to rush through steps, grasping for common choices like human error that may not provide much useful insight. Incident management software with purpose-built AI capabilities can help here, relying on extensive training on EHS datasets to accurately identify root causes, and present professionals with a curated list of selections.
For all these reasons, RCA metrics make great leading indicators. In the first blog in this series, you learned about OSHA’s SMART principles for selecting good leading indicators. For example, effective metrics are those most relevant to your primary safety objectives and those you can sustainably track. RCA is very relevant to your safety objectives, assuming that one of your primary objectives is to prevent injuries. RCA is also trackable because the same safety software with purpose-built AI capabilities also facilitates tracking of RCA.
For example, you can track root cause by incident, or root cause by hazard type, so you can identify the trends you most need to understand to improve safety.
Actions Tracking
An action, sometimes called a corrective action or a corrective and preventive action (CAPA), is what is done in response to identified risks, hazards, or safety program deficiencies. One of the most common ways to initiate an action is through an incident investigation because you identify root causes and take follow-up actions to address them. But there are many other ways to get more actions to do, including conducting an audit, doing an inspection, or having a safety meeting.
In fact, one of the major challenges in EHS management, especially for those caught in the reactive safety management cycle, is that so much of what an EHS professional does from start to finish each day generates more actions. That’s why percentages of completed actions tend to lag in reactive organizations. The challenge is there’s little in EHS management that undermines employee support for your programs as much as failure to complete actions on schedule. Employees who see their organization falling behind on finishing actions will be less likely to contribute their efforts and insights because they may conclude there is no point in doing so.

Action management software helps you break out of that cycle. The same AI capabilities that improved your RCA can also recommend effective actions based on your RCA and incident description. The software then funnels all actions generated across many different safety management activities into one place, facilitating prioritization, tracking, and follow-up. From there, advanced dashboards can give you real-time access to important metrics, such as total number of actions completed, and the percentage of actions completed on time.
With this data at your fingertips, you’ll be able to assess how well you’re doing at getting actions across the finish line. As all good leading indicators should do, these metrics support your primary goal of reducing workplace injuries by addressing identified risks.
Other Useful Incident Management Metrics
Depending on which ones are most useful to your organization, there are many other potentially useful safety metrics to track.
You need relevant metrics, discussed earlier, especially when it comes to leading indicators. But you also need a balanced set of leading and lagging indicators. The industry standard on safety metrics, ANSI/ASSP Z16.1, emphasizes that lagging and leading indicators work together to give you insights into past performance, and your completion of activities tracked in leading indicators intend to positively influence future performance. A balanced set of metrics arms you with the data you need to drive better management decisions.
With these considerations in mind, other metrics to prioritize tracking on dashboards include:
- – Hazard type by incident: This metric can help you move beyond surface-level risk takeaways to a deeper understanding of risk. You’ll be able to see which hazards are associated with the most incidents, so you can focus on addressing more impactful risks.
- – Hazard type by root cause: Here, you can go a level deeper in your analysis, homing in on the hazards flagged as root causes in incident investigations.
- – Trending incidents over time: See which types of incidents are getting more frequent, so you can interrupt injury patterns earlier.
Collectively, use of advanced dashboards and reporting to track PSIFs alongside other carefully chosen metrics is a game changer. You’ll have the insights you need to move from an approach based on asking “how many incidents happened?” to an approach based on asking “what risks are hurting us and where our controls are failing?”
It’s the difference between using safety data as a report card and using safety data as part of a playbook. Thanks to AI for EHS capabilities and modern reporting features, this transition is more achievable than ever.
Looking for More Information?
Stay tuned for more insights in the coming weeks, including best practices to level up your EHS management, new data about the challenges, pain points, and outlook of EHS professionals, and actionable insights on how safety professionals like you leverage technology in their roles.
In the meantime, check out other resources on AI and EHS and strategies for adopting a proactive management approach, including:
- – Leveraging AI to Move Beyond Regulatory Compliance
- – Five Use Cases for Vēlo
- – EHS Software AI Capabilities & Vendor Evaluation Checklist
- – AI in Safety Coffee Chat series
- – Why EHS Professionals Can’t Afford to Ignore AI
Also, be sure to follow our blog for more information on the latest EHS news and insights.
Ready to See Advanced Dashboards and Reports in Action?
VelocityAI capabilities are human-centered and built by EHS experts for EHS experts. They are designed to integrate with core workflows, surface actionable insights, and support safety leaders in driving measurable outcomes.
There’s never been a better time to check out VelocityAI because Advanced Reporting and Dashboards now can compile data from the AI incident management features, including AI PSIF Insights, metrics on root causes and corrective actions, and insights into trending injury types. They even provide ROI data on avoided costs for addressed PSIF risks.
If you’re ready to explore how AI can elevate your EHS program, VelocityEHS can help you take the next step.